BDC Common Stocks Market Recap: Week Ended October 8, 2021
BDC COMMON STOCKS
Week Forty
Thrived
Barron’s said it best: “The stock market survived a scary week”.
Investors had to contend with higher energy prices; a potential U.S. default and a weak jobs report.
Nonetheless “The Dow Jones Industrial Average gained 1.2% this past week, while the S&P 500 rose 0.8%, and the Nasdaq Composite squeaked out a 0.1% advance“.
The BDC sector performed even better: up 1.26% on the week.
Right Direction
That was the third week in a row that the sector’s price performance has been in the black, calculated through the performance of BDCZ – the UBS Exchange Traded Note which owns most of the BDC stocks.
Confirming this trend is the Wilshire BDC Index – using the “total return” feature – at 346.700.
That was an increase of 1.49% – also up for the third week in a row.
The number of BDCs – out of 42 in the public universe that we track – which posted an increase in price week over week was 33.
That’s the highest number by that familiar metric to any BDC Reporter reader since the end of August.
Tops
4 BDCs traded up in price by 3.0% or more during the week – a relatively low number for a strong overall week – and none dropped by more than (2.02%).
The four 3.0% plus winners were a motley crew:
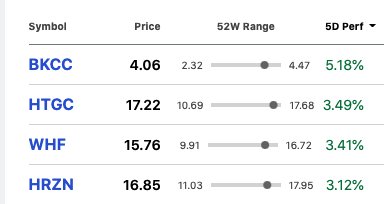
Supposition
Our suspicion is that these price increases represent investor positioning in advance of IIIQ 2021 earnings season – about three weeks away.
These sudden enthusiasms may suggest some investors believe these BDCs are – relatively speaking – undervalued.
Given that we’ve frequently seen stocks that jump up in this way drop back to earth after the results come out we won’t promise that the markets are infallible.
More Of The Same
Getting back to the telling metrics that we review weekly – and sometimes daily:
The number of BDCs trading above book value (see the BDC:NAV Change Table for the specifics) was up to 17 from 15 the week before.
Also, the number of BDCs trading within 5% of their 52 week highs is up to 18, from 16 the week before.
One Month Out
Looking at BDC prices with a slightly wider lens, we note that over the month exactly half all BDCs are up in price.
That may not sound particularly strong, but just a month ago that number was 7, as the sector contended with a downward trend.
Those other popular metrics : price versus the 50 day and 200 day moving average also suggest improvement.
The former sees 26 BDCs in the black and the latter 37.
2021
On a YTD basis, BDCZ is up a powerful 23.7% and the Wilshire BDC Index Total Return 26.6%.
The latter is at an all-time high going by the weekend price.
According to Seeking Alpha only two BDCs (Great Elm Capital and Goldman Sachs BDC) are at lower prices now than at year-end.
38 BDCs are up in price by double digit percentages.
Here are the top 10 price gainers in 2021:
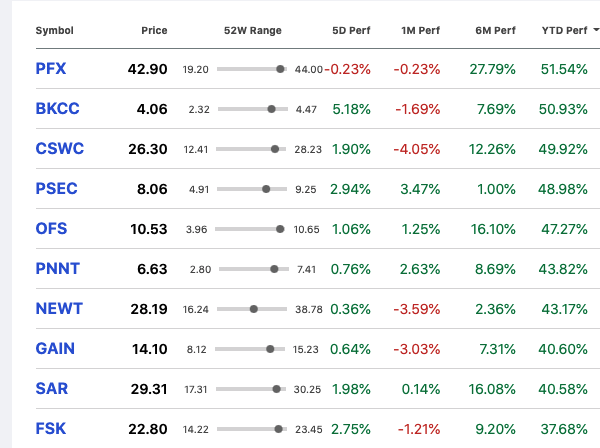
No Stock Left Behind
By the way, Seeking Alpha data indicates every BDC we track is up in price over a 1 year time frame – underscoring the all inclusive rally that we’ve been having from the March 2020 lows.
So Close…
With just 12 weeks to go in 2021, BDCZ is only (1.1%) below its 52 week high that was set in June.
Looking Forward
The BDC Reporter continues to believe that if the markets are willing and the creek don’t rise – to coin a phrase – the BDC sector is poised to set a new price height (using BDCZ as our guide) sometime soon.
We’ve already hedged ourselves, though, by what might happen to the broader indices.
It’s unlikely that the BDC sector can break price records if we get a sustained (5% plus) move to the downside by the S&P 500, Dow and NASDAQ.
Also, if IIIQ 2021 BDC results are poor in terms of net book value, Net Investment Income Per Share or credit, investors might not be prepared to move forward.
Mostly Good
However, most of the signs are positive in this regard.
We saw Saratoga Investment (SAR) report an unexpectedly large increase in EPS over expectations, but it’s also true that the NAV Per Share recorded of less than 1% was weaker than we might have expected.
Still, both Ares Capital (ARCC) – far and away the biggest component in BDCZ – and SAR reached new 52 week highs this past week, which sounds auspicious.
Record Breaking
Also – as most everyone knows – the leveraged loan markets are super-busy going into the final stretch of the year.
That might result in lower loan spreads and some BDCs seeing repayments exceeding new investments – i.e. portfolio shrinkage.
However, the most obvious consequence in the short term is likely to be higher pre-payment and origination fees.
Also, we continue to expect to hear about realized (and unrealized) gains from most BDCs equity stakes thanks to the red hot environment.
As we’ve noted before – and received more confirmatory evidence when deep diving recently into Investcorp Credit Management’s (ICMB) portfolio – a number of underperforming companies are getting rescued by the wall of money in the markets.
Moreover, most BDCs have written down their troubled credits very sharply and have (more or less) nowhere to go but up as each company finds some sort of resolution.
Very Low
Then there’s the seemingly endless flow of inexpensive unsecured debt being raised by BDCs of all sizes, which is both lowering borrowing costs and improving liquidity.
This week, FS KKR Capital (FSK) raised a very large amount of debt, as did Bain Capital (BCSF).
Prospect Capital (PSEC)- bless them – are once again tendering for expensive unsecured debt (6.375%) on their balance sheet, given that the BDC can borrow currently at half the cost.
As always, though, we wonder if PSEC is generous enough to its debt holders to get them to part with that debt due in 2024, paying way over current market yields.
Investors looking further out than the next quarter will be comforted by the knowledge that borrowing costs could continue to shrink well into 2022 as both prior financings and new ones planned impact the bottom line.
While we’re optimistic, we recognize that we’re painting with a broad brush and that “individual results will vary”.
Boosted
This is especially the case with the large number of BDCs whose EPS has been boosted temporarily by deliberate waivers of fees by the manager or by the terms of their compensation agreements.
Many BDCs are hoping – sometimes in the nature of a “wing and a prayer” – that the current conditions will allow them to charge full fees AND “cover” their current dividend with earnings.
If that should not occur, it will be interesting to see which BDC managers step up to “protect” the distribution by offering compensation concessions and in what form and how long.
The level of generosity that may, or may not, occur could impact BDC dividend levels (i.e. result in cuts) and that could translate to price levels.
Generally speaking, the BDC managers are making very good money from fees of all sorts so we should expect to see shareholders treated leniently.
The state of BDC corporate governance being was it is, though, how this turns out at Apollo Investment (AINV); BlackRock Capital (BKCC); Bain Capital (BCSF) – and several others, is up to the advisors involved.
Shareholders will have to stand by and find out how they are treated.
Welcoming
We’ll have to remember that Week 40 of 2021 is when the public BDC universe – which has seen its number of players drop from 46 to 41 in recent years – add a new member.
Of course, the new addition is Cion Investment (CION) – a relatively large non-traded player who joined the NYSE this week.
CION was the 8th largest non-traded BDC by portfolio value and 23rd overall.
The BDC Reporter has already published Part I of a Primer on CION.
This week, look for Part II where we – amongst other things – project what sort of EPS and dividend CION might post in the quarters ahead.
Coverage
In any case, with CION, the number of public BDCs in our universe increases to 42.
(We’re busy updating the BDC Reporter’s various tables to include the new entrant).
We calculate the aggregate fair market value of these BDCs portfolio is $98.5bn.
By the way, Advantage Data – whose data gathering is more comprehensive than our – places the size of the entire BDC universe at $153bn.
That includes many non-traded players and a few public BDCs investing principally equity in the venture capital and other sectors.
We did some digging into AD’s tables, which suggest that the BDC Reporter is providing coverage of all but 4 public BDCs.
The 4 exceptions to the rule are all equity/VC focused and their combined FMV is very modest.
We believe we can say without fear of contradiction that the BDC Reporter continues to offer comprehensive coverage of the public side of the ever-growing BDC sector.
Already a Member? Log InRegister for the BDC Reporter
The BDC Reporter has been writing about the changing Business Development Company landscape for a decade. We’ve become the leading publication on the BDC industry, with several thousand readers every month. We offer a broad range of free articles like this one, brought to you by an industry veteran and professional investor with 30 years of leveraged finance experience. All you have to do is register, so we can learn a little more about you and your interests. Registration will take only a few seconds.