Cion Investment Corporation: A Primer On The Newest Public BDC – Part I
Preamble: Now that Cion Investment (CION) has become the 42 public BDC in the BDC Reporter’s coverage universe, we’ve undertaken a fast deep dive into the information available to provide ourselves – and our readers – with a preliminary undertanding of its history, strategy and performance spanning the last ten years. There’s a lot of ground to cover, and we’ll have to write a second article when seeking to describe what Cion’s future as a public company might look like.
HISTORY
Cion Investment Corporation, or Cion, was incorporated under the general corporation laws of the State of Maryland on August 9, 2011. Cion was inactive initially, only filing for the first time in the IIQ 2012. The BDC was managed from the outset by Cion Investment Management (“CIM” or the “Advisor”). CIM immediately engaged Apollo Investment Management, L.P. – or AIM – a subsidiary of Apollo Global Management as sub-adviser. The two principal firms each invested $1.0mn of equity to form the BDC. A Form N-2 registration statement was filed, announcing the intention to issue up to $100mn shares at a price of $10.0. The registration statement was declared effective by the SEC on July 2, 2012. Operations did not begin till December 17, 2012, thanks to raising $2mn from investors and investing in two companies.
Here are key milestones in the BDC and Advisor’s history:
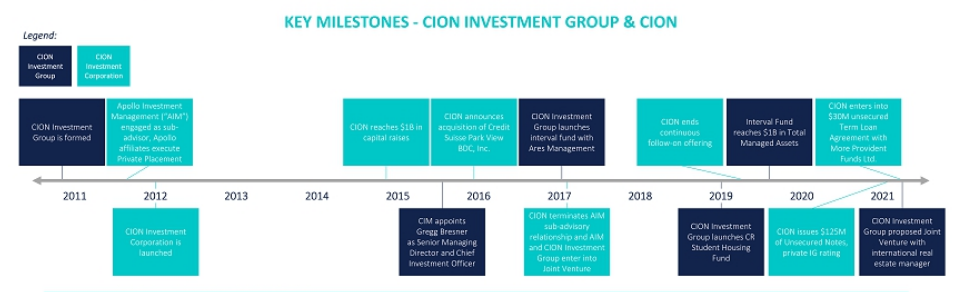
The BDC’s initial continuous public offering commenced on July 2, 2012 and ended on December 31, 2015. This was followed by a “follow-on continuous public offering” that commenced on January 25, 2016 and ended on January 25, 2019.
Since commencing its initial continuous public offering on July 2, 2012 and through March 31, 2019, Cion sold 113,401,873 shares of common stock for net proceeds of $1,155,287, at an average price per share of $10.19.
In 2021, the BDC took various actions in anticipation of listing Cion on the NYSE. These measures included expanding the size of the Board and changing the fee arrangements between the BDC and the Advisor. In addition, the Board approved a 2:1 reverse stock split, which became effective on September 21, 2021.
On October 5 2021, Cion’s shares began to officially trade publicly.
Here’s a link to a CNBC interview of Cion’s co-CEO on the day of the stock trading launch.
See also the Investor Presentation prepared September 24, 2021 which addresses both the BDC’s background and future plans and is one of the key sources of this write-up.
PERFORMANCE
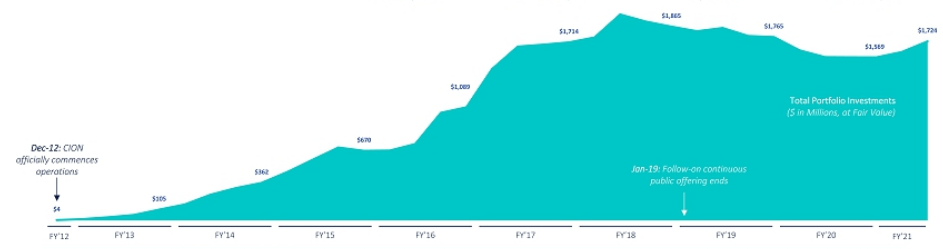
As shown above, thanks to the regular influx of new equity capital and as many as four secured borrowing facilities, Cion’s investment portfolio increased substantially in size and in the number of portfolio companies over the years. The BDC peaked in FY 2018 at a size of $1.865bn at fair market, just before the end of the “follow-on continuous public offering”.
NAV PER SHARE
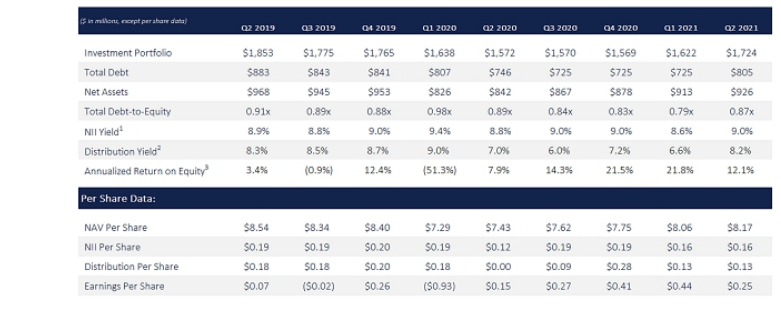
As of the first full year of operation in 2013, NAV Per Share was $9.32 and by FY 2018 to $8.69. At the end of FY 2019 – just before the pandemic, NAV Per Share was $8.40. As this chart below demonstrates Cion – like all other BDCs both public and private – saw its net book value greatly impacted by the pandemic. The NAV Per Share dropped to a low of $7.29 in IQ 2020. However – and also like most of its BDC peers – the metric has improved steadily in subsequent quarters. As of the end of June 2021, NAV Per Share was up to $8.17. However, that remains (3%) below the pre-pandemic level.
DISTRIBUTIONS
Prior to the pandemic, Cion was distributing $0.18 a quarter (in a weekly format) and paid out a supplement of $0.02 in the IVQ 2019. However, the Advisor suspended all distributions at the beginning of the pandemic, due to the uncertainties at the time. At that point, debt to equity was very close to the BDC’s regulatory 1.00x limit, reaching 0.98x due to the losses incurred at the time. However, by August 2020 dividend payments resumed (paid out monthly) but have been reduced. As of October 5, 2021, the BDC has announced a fourth quarter regular distribution of $0.1324 and a “special” distribution in a range of $0.07-$0.10. The regular distribution is approximately (25%) lower than prior to the pandemic.
The Advisor has not guided shareholders as to what dividend might be paid going forward from 2022 on, both as the amount of the dividend or its frequency of payment.
CREDIT QUALITY
The BDC undertakes a quarterly 5 point rating of its portfolio assets, where 3-5 represent varying degree of underperformance. As the Investment Rating charts below show – copied from Cion’s 10-Ks – the BDC had moderate credit issues even in FY 2018, with 11.4% of the investments underperforming. That rose to 17.4% BEFORE the pandemic began, as the 2019 results show and continued through 2020, ending at 21.3%, albeit pricipally in Investment Rating 3.
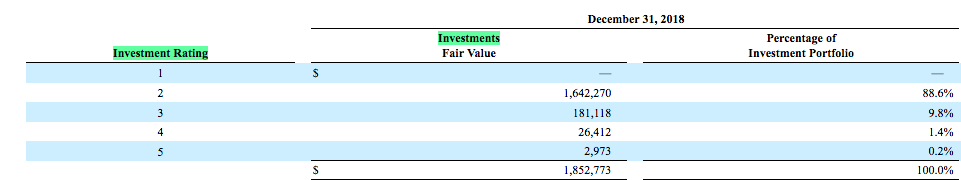

The most recent update from June 2021 suggests the portfolio is performing close to 2019 levels, with 17.5% of investments under-performing. That jibes with the NAV Per Share differentials discussed above.
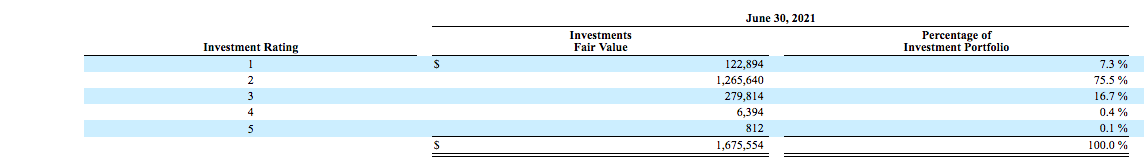
However, note that CION booked ($73.6mn) in net realized losses in 2020 and the first half of 2021, which are not reflected in the latest Investment Ratings. This compares to ($56.8mn) of realized losses in the three years between 2017-2019.
NON ACCRUALS
As is he case with some other BDCs, Cion does not offer fulsome information about the identity and status of its non performing investments. The latest disclosure is that non accruals have a fair market value equal to 0.4% of the portfolio as a whole. or $7mn.
After reviewing the footnotes of the 10-Q, we identified 6 companies on non accrual – most of which we are familiar with from the BDC Credit Reporter because widely held in the BDC community. The names are Charming Charlie; Country Fresh Holdings; F&W Media; Sequoia Healthcare Management; Deluxe Entertainment Services and Premiere Global Services.
There is considerable amount of information about these companies in the BDC Credit Reporter and we could spend much time de-constructing each one but given that these investments have been written down to an immaterial value, we won’t bother.
STRATEGY
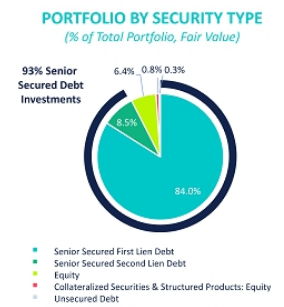
From the outset CION’s objective has been to focus on senior loans. Here’s a pie chart that shows senior debt represents 93% of assets, spread over 132 companies:
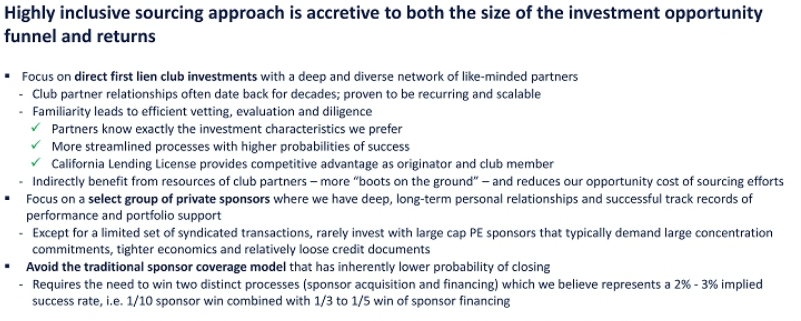
The BDC principally participates in so-called “club deals” with other lenders, sometimes as the lead and most often as a participant. Moreover, Cion stays away from the largest private equity groups, whose financial demands are deemed uneconomic for the BDC. Here’s the pitch by the BDC in its Investor Presentation about the advantages of this sourcing strategy:
PERFORMANCE SUMMARY
It may be unfair to seek to summarize nearly a decade of the BDC’s performance after only a few hours of review, so consider what follows our PRELIMINARY assessment.
Undoubtedly Cion has been very successful in growing its balance sheet over the years, but has been stymied in the last three years by less equity capital coming in; higher losses and bumping up against the leverage limit, set at the lower level of 1:1.
There appears to have been consistency in terms of the type of investments made and the senior management team involved.
As of 2019 – just before the pandemic – Net Investment Income of $87mn was achieving a return of equity – using the year end NAV – of 9.1%, which is in the middle of the pack where BDCs are concerned.
However – even then – realized losses were more than a quarter of recurring income achieved.
Overall, a tenth of all equity capital raised had resulted in “Accumulated Distributable Losses” by that date.
Cion fared moderately well through the pandemic until the present day (i.e. through June 2021).
As we’ve seen, the BDC did have to book substantial realized losses but has little in the way of non performing assets remaining and underperforming assets – as a % of the portfolio – are similar to the 12/31/2019 level.
However, lower LIBOR and tighter spreads have caused CIon’s investment income to drop (23%) when comparing IIQ 2019 to IIQ 2021.
Likewise, NII has dropped by (14%) even though the BDC has not been paying the Advisor an incentive fee in 2021, as the minimum return has not been achieved.
Not surprisingly, the dividend received has also been reduced in these last two years by (25%) at a time when many – but not all public – BDCs have been able to maintain or even increase their payouts.
All in all – at this stage – we’d rate Cion’s historical financial and credit performance as somewhere between average to below average by sector standards.
COMING UP IN PART II
There’s obviously a small amount of information to convey about Cion.
In the article above we’ve concentrated on the newly public BDC’s history.
In a second article we’ll discuss what Cion will look like going forward.
The investment strategy is said to be unchanged, but the BDC’s regulatory and target leverage is being altered, as are its compensation arrangements with the Advisor.
Furthermore, a stock buyback program has been announced, which we’ll discuss.
Already a Member? Log InRegister for the BDC Reporter
The BDC Reporter has been writing about the changing Business Development Company landscape for a decade. We’ve become the leading publication on the BDC industry, with several thousand readers every month. We offer a broad range of free articles like this one, brought to you by an industry veteran and professional investor with 30 years of leveraged finance experience. All you have to do is register, so we can learn a little more about you and your interests. Registration will take only a few seconds.