Horizon Technology: IIIQ 2021 Conference Call Transcript – ANNOTATED
Q3 2021 Horizon Technology Finance Corp Earnings Call
Farmington Oct 27, 2021 (Thomson StreetEvents) — Edited Transcript of Horizon Technology Finance Corp earnings conference call or presentation Wednesday, October 27, 2021 at 1:00:00pm GMT
Corporate Participants
Daniel R. TrolioHorizon Technology Finance Corporation – Executive VP & CFOGerald A. MichaudHorizon Technology Finance Corporation – President & DirectorMegan N. BaconHorizon Technology Finance Corporation – Director of IR & MarketingRobert D. PomeroyHorizon Technology Finance Corporation – Chairman & CEO
Conference Call Participants
Ryan Patrick LynchKeefe, Bruyette, & Woods, Inc., Research Division – MDSarkis SherbetchyanB. Riley Securities, Inc., Research Division – Associate Analyst
Presentation
Robert D. Pomeroy Horizon Technology Finance Corporation – Chairman & CEO
“Good morning. Thank you for joining us and for your continued interest in Horizon. Today, I will update you on our performance and our current overall operating environment. Jerry will then discuss our business development efforts, our portfolio events and our markets. Dan will detail our operating performance and financial condition, and then we will take some questions.
Our third quarter was a testament to the power of the Horizon brand and the lending platform of our advisor, Horizon Technology Finance Management, as well as our continuing efforts to grow our portfolio. We executed in all aspects of our operations, and we are proud of the results.
During the quarter, our portfolio grew to more than $450 million, a 12% increase from the end of the second quarter and up 28% from the end of 2020. These numbers are even more impressive when you consider that the portfolio experienced $50 million in prepayments during the third quarter.
BDC Reporter Notes: This is an above average growth rate for the BDC sector but for context Ares Capital (ARCC) – which has also reported – grew its portfolio at FMV by 14% in 2021, and Oxford Square (OXSQ) by 37%. Given the go-go environment, we are in a period of AUM growth across many BDCs.
We finished the third quarter with a committed backlog of $101 million, providing us with momentum to continue our portfolio growth. We generated net investment income of $0.40 per share, well in excess of our distribution level for the quarter, thanks to the continued success of our predictive pricing strategy.
BDC Reporter Notes: We compared the latest P&L to the IIQ 2021. Both interest income (far and away the biggest component) and fee income were up, bring total investment income to $16.4 to $13.5mn. Of the $1.9mn increase, $1.3mn was due to high er fee income, something of an irregular event. Expenses seemed consistent from quarter to quarter, with interest and compensation costs all higher as you’d expect in a growth situation. NII was $8.0mn versus $6.2mn a quarter before.
Based on our outlook and our undistributed spillover income of $0.44 per share as of September 30, we declared monthly distributions through March of 2022, which marks 63 consecutive months at $0.10 per share. In addition, we declared a special distribution of $0.05 per share payable in December.
BDC Reporter Notes: Here’s what we said in Tuesday’s Daily Update about HRZN’s distributions over the past 3 years:
“HRZN’s total distribution level of $1.25 in 2021 is equal to what was paid out in 2020 and $0.05 above the 2019 level. Yet, on this minuscule amount of dividend improvement HRZN’s stock price has increased by 32% since the end of 2019 and its NAV Per Share has dropped slightly (2%)”.
BDC Daily Update Tuesday October 26, 2021
We achieved a portfolio yield on our debt investments of 16.2% at or near the top of the BDC industry. We maintained a stable portfolio credit profile with 97% of our portfolio rated 3 or higher. We are consistently and actively managing our portfolio of investments to maintain its credit quality.
We ended the quarter with NAV of $11.63 per share, a $0.43 per share increase from June 30, resulting from a combination of outearning our distributions, accretive share issuances and increases in fair value of some of our investments.
BDC Reporter Notes: As the BDC: NAV Change Table reminds us, though, NAV Per Share remains 2% below the level of IVQ 2019. Like every BDC HRZN saw asset values drop at the beginning of the pandemic. Then – and more specific to HRZN – a number of investments worked out poorly and had to be written down, resulting in lower NAV Per Share for two quarters in a row in the second half of 2020, when most other BDCs were registering increases in this metric. Unfortunately, over its history HRZN has not been able to consistently book realized and unrealized gains in excess of losses. As a result, the current NAV Per Share is (0.8%) below the level of the IVQ 2017. By contrast, that other famous venture debt BDC – Hercules Capital (HTGC) – boasts a 17.6% increase in NAV Per Share through the IIQ 2021, and that may go higher when IIIQ 2021 numbers are released.
Finally, our balance sheet remains strong with ample capacity to fund more growth in our portfolio and move closer to our target leverage of 1.2:1.
We achieved a portfolio yield on our debt investments of 16.2% at or near the top of the BDC industry. We maintained a stable portfolio credit profile with 97% of our portfolio rated 3 or higher.
BDC Reporter Notes: Not to be finicky but HRZN’s portfolio valuation system differs from most other BDCs in that most every investment is valued at the original cost unless something drastic has occurred. Other BDCs seek to value each investment every quarter and this can cause temporary drops in value.
We are consistently and actively managing our portfolio of investments to maintain its credit quality.
We achieved these excellent results due to our advisor’s incredible team, focused predictive pricing strategy, discipline in selecting quality investments and expanded lending platform. For the quarter, the advisor’s platform funded a record $141 million in new business in what is typically a lighter quarter for originations. Our advisor is competing for and winning larger, high-quality venture debt investments, while at the same time, continuing to diversify our portfolio and further reducing concentration risk.
Given the momentum generated in the third quarter, we believe we remain well positioned to continue growing our portfolio of investments and to continue producing strong net investment income. Our belief is supported by the following: our advisor continues to strengthen the Horizon platform with new hires; demand for venture debt within our target industries remains robust; our committed backlog and pipeline of investments is still strong; our advisors expanded lending platform and the increasing recognition of the Horizon brand is enabling us to access a considerably larger number of investment opportunities, and we continue to maintain ample capacity to execute on our backlog of commitments as well as our advisor’s pipeline of new opportunities.
While we were excited and optimistic for Horizon’s future, we remain aware of possible headwinds from macroeconomic issues, including the supply chain, global inflation, labor issues and the pandemic. Over the years, our advisors’ experienced team has successfully managed portfolios through various economic cycles. I am proud of our entire team’s efforts, which resulted in this excellent quarter for us and our shareholders.
Gerald A. Michaud Horizon Technology Finance Corporation – President & Director
Thanks, Rob, and good morning to everyone. The third quarter is typically the lightest quarter for us in terms of originations, which makes our origination performance in the third quarter all the more impressive. Our portfolio topped $450 million for the first time ever at the end of Q3. With the robust demand for venture debt, we funded a record 15 transactions totaling $99 million during the quarter. Our onboarding yield of 11.5% during the quarter reflected our advisers predictive pricing strategy and continued discipline in pricing transactions that we believe will produce strong NII. We experienced 4 loan prepayments during the quarter, totaling $50 million and the prepayment fees and accelerated income from the prepayments contributed to our debt portfolio yield for the quarter of 16.2%, again, among the top in the BDC industry.
BDC Reporter Notes: The 16.2% “yield” is very impressive but does depend largely – as management notes – as to how many loans are repaid in the period and garger an end of term payment, which boosts the yield. The on-boarding yield, which is how much the BDC earns without the benefit of those pay-offs is also high, but down from the 12%-13% the BDC was earning just a short time ago. We expect that in the venture debt field – as in all leveraged lending – margin spreads are tightening. This must be compounded in HRZN’s case as they avowedly are aiming to book larger transactions with better quality borrowers, which will result in lower yields.
In addition, we received proceeds of $1.5 million from the exercise or termination of warrants as well as proceeds of $1.1 million from success fees related to 2 debt investments, a further testament to our method of structuring investments to generate additional yield. As of September 30, we held warrant and equity positions in 74 portfolio companies with a fair value of $21 million. Since the beginning of 2020, the company has received approximately $13 million in proceeds from warrant and equity investments. As we’ve consistently noted, structuring investments with warrants and equity rights is a key aspect of our venture debt strategy and an additional value generator.
BDC Reporter Notes: To provide a fuller picture, note that realized losses YTD, even after this quarter’s realized gains is ($2.8mn). In 2020, total realized losses were ($14.7mn) and in 2019 ($4.2mn). In fact, HRZN has not booked net realized gains from its equity and warrant activity since 2018 and that was only for $0.6mn. To a large degree what HRZN is gaining on the roundabouts in terms of net investment income is being lost in the debt and equity write-offs swings.
In the third quarter, we closed $91 million in new loan commitments and approvals and ended the quarter with a committed and approved backlog of $101 million compared to $144 million at the end of the second quarter. Our advisor also ended the quarter with an additional $48 million in newly awarded transactions. While there is no guarantee we will fund all of the transactions in the committed or awarded backlogs, the total supports a positive funding outlook.
In addition, our advisor ended the quarter with a pipeline of new opportunities totaling $734 million.
Subsequent to the end of Q3, we funded a $2.5 million venture debt loan and received $35 million in loan prepayments, including the prepayment in full of our debt investment in Topia, which was 2 rated at the end of Q2. These early prepayments in the fourth quarter will obviously benefit NII in Q4, but will also provide a challenge to our efforts to grow our portfolio during the quarter.
Nonetheless, as of today, our committed backlog has grown to $146 million and our advisor’s awarded backlog has increased to $50 million. In addition, our advisor’s pipeline of new opportunities today is approximately $697 million, providing us with a solid base of opportunities to further grow our venture debt portfolio over the coming quarters. The significant growth in our portfolio has been achieved while maintaining its robust credit quality as the fair value of 97% of the company’s debt portfolio consisted of 3 and 4 rated loans as of September 30, an increase from the prior quarter’s end. As further indication of the credit quality of our portfolio, one of our portfolio companies, CVRx went public during the third quarter, 2 of our portfolio companies Bardy Diagnostics and OutboundEngine’s completed M&A transactions and 3 of our portfolio companies have entered into SPAC transactions.
During the quarter, 1 smaller investment migrated down to the 1 rated bucket, while a larger 2 rated credit was upgraded to a 3 rating. As always, we and our advisor are aggressively managing the remaining 1 and 2 rated credits in order to achieve the best possible outcome.
BDC Reporter Notes: BDCs don’t like to be specific so we’re left to undertake detective work. We surmise that the upgraded company might be Betabrand Corp, a women’s clothing business, and home of “Dress Pants Yoga Pants”. As we determined on Advantage Data, the debt, which was discounted (9%) last quarter, has improved to a (1%) discount this period. A $7.9mn investment is involved.
The company moving down the table seems to be Stereo Vision Inc., which also went on non accrual this quarter. Some $3.8mn is invested, mostly in debt, which is discounted between (7% ) and (12%). This is a facial recognition business, which HRZN has been funding since 2018, which happens to be when the company acquired Digital Signal Corporation. Here’s a brief description of Stereo Vision – based near us in Pasadena – lifted from the press release at the time of the acquisition:
“StereoVision Imaging is a privately-held corporation based in Pasadena, California. The Company has developed and deployed with the U.S. Military a revolutionary mid-range, hand-held 3D facial recognition technology that integrates traditional binocular optics with proprietary image enhancement facial analytic algorithms. This technology enables the identification of non-cooperative “persons-of-interest” under challenging uncontrolled environmental conditions with very high levels of accuracy. Additional information about SVI can be found at www.stereovisioninc.com“.
Turning now to the venture capital environment. It almost, across the board, hit new full record highs in only 9 months. According to PitchBook, approximately $83 billion was invested in VC-backed companies in the third quarter, an increase over last quarter’s total. From the beginning of the year through the third quarter, approximately $239 billion of venture capital has been invested, putting it on pace to double last year’s record of $166 billion.
In terms of VC fundraising, $22 billion was raised in the third quarter and $96 billion has been raised through September 30, already breaking last year’s full year record and virtually assuring the VC fundraising will clear the $100 billion milestone before the end of the year.
Larger VC funds continue to drive the bulk of increased fundraising.
Regarding VC-backed exit activity, the IPO and SPAC window stayed open in the third quarter with venture-backed IPOs and SPACs helping to drive a total excess value in the quarter of over $187 billion. For the year through September 30, exit value has shadowed the $500 billion mark, although recent underperformance by some SPAC combinations is raising questions as to whether the SPACs are a viable long-term alternative to IPOs.
BDC Reporter Notes: This – justified – dig at SPACs may be partly related to the fact that this over-hyped vehicle has been a competitor of sorts to venture-debt BDCs, given their ability to raise large amounts of capital for businesses.
There are a wealth of options for venture-backed companies to generate additional liquidity which provides us with both an opportunity and competition for technology and life science investments. With our advisor strong and active lending platform, we believe we are well positioned to compete and win in this environment.
Turning now to our lending markets. They continue to offer many quality investment opportunities to restock our committed backlog and our advisor’s pipeline. During the quarter, we made $63 million in debt investments to 8 new portfolio companies consisting of 3 new life science investments, 1 new sustainability investment and 4 new technology investments providing further diversification to our portfolio.
We also funded $36 million to 7 of our existing portfolio companies.
Supply chain challenges, COVID risks and inflation concerns, all have the potential to disrupt our markets and impact our portfolio companies. Accordingly, we are taking the potential impact of each of these issues into account as we underwrite new investments including transparent discussions with our prospective portfolio companies and their investors.
BDC Reporter Notes: We hear from HRZN – and other BDCs – about their concerns about inflation, supply chain troubles and all the rest, but we’ve seen no discernible slow down in investing as a result. Lenders appear to be able to climb their wall of worry relatively easily as do sponsors, as the record volumes being booked attest to.
That said, demand for venture debt remains abundant in the life science, technology and sustainability markets. Our advisor remains disciplined in its marketing and underwriting, and we expect to onboard new quality investments over time, which will continue to grow our portfolio with ample capacity, a deep pipeline and a predictive pricing strategy, we remain well positioned entering Q4 to deliver additional long-term shareholder value.
Daniel R. Trolio Horizon Technology Finance Corporation – Executive VP & CFO
Thanks, Jerry, and good morning, everyone. As Rob and Jerry mentioned, we had another excellent performance in Q3 as we significantly grew our portfolio and generated strong NII while maintaining a strong overall balance sheet. As of September 30, we had $88 million in available liquidity, consisting of $43 million in cash and $45 million in funds available to be drawn under our existing credit facilities. As of September 30, there was $38 million outstanding under our $125 million KeyBank credit facility and $66 million outstanding on our $100 million New York Life credit facility, leaving us with ample capacity to grow the portfolio.
Additionally, through our ATM program, we successfully and accretively sold 395,000 shares opportunistically raising nearly $7 million. Our debt-to-equity ratio stood at 1.1:1 as of September 30, which is lower than our target leverage of 1.2:1. Based on our cash position and our borrowing capacity on our revolving credit facilities, our potential new investment capacity at September 30 was $165 million.
BDC Reporter Notes: HRZN has more than enough liquidity to meet its investment needs. We wonder, though, if using an At The Market (ATM) program for raising equity will be sufficient to satisfy management’s need for capital. As we mentioned for ARCC, there’s a good chance that HRZN will undertake a secondary stock offering before long. As they say “If not now, when ?”.
As you go towards our target leverage, we would expect that our NII will also increase. For the third quarter, the company earned total investment income of $16.4 million, an increase of 33% compared to the prior year period. Interest income on investments increased primarily as a result of higher average earning debt investment portfolio for the quarter, and fee income also increased due to higher prepayment and success fees received from 2 of our debt investments.
Our debt investment portfolio on a net cost basis stood at $431 million as of September 30, an 11% increase from June 30, 2021. For the third quarter of ’21, we achieved onboarding yields of 11.5% compared to 12.2% achieved in the second quarter. Our loan portfolio yield was 16.2% for the third quarter, up 110 basis points from 15.1% for last year’s third quarter.
Turning to our expenses. For the third quarter, total expenses were $8.3 million compared to $6.5 million in the third quarter of 2020. Our performance-based incentive fee was $2 million, an increase from $1.5 million for last year’s third quarter based on higher NII generated in the third quarter of ’21.
Our interest expense increased to $3.1 million from $2.6 million in last year’s third quarter due to an increase in average borrowings. Our base management fee was $2 million, up from $1.6 million in last year’s third quarter due to an increase in the average size of our portfolio.
Net investment income for the third quarter was $0.40 per share compared to $0.31 per share in the second quarter of ’21 and $0.34 per share for the third quarter of 2020. The company’s undistributed spillover income as of September 30 was $0.44 per share.
BDC Reporter Notes: With so much growth underway, and with this quarter’s earnings way above the $0.30 paid out in distributions, one might have expected an increase in the regular distribution. Instead, shareholders received only a relatively small $0.05 special payout, and $0.44 per share of spillover income was retained. This, too, suggests another round of common stock issuance might be in the cards. Although much has changed in the intervening years, HRZN’s shareholders have been receiving the same $0.10 monthly distribution since December 2016. However, the advisor’s compensation has increased four fold.
To summarize our portfolio activities for the third quarter, new originations totaled $99 million, which were partially offset by $3 million in scheduled principal payments and $50 million in principal prepayments. We ended the quarter with a total investment portfolio of $452 million. The portfolio consisted of debt investments in 43 companies with an aggregate fair value of $430 million and a portfolio of warrant, equity and other investments in 76 companies with an aggregate fair value of $21 million.
BDC Reporter Notes: Our credit review has identified only 3 companies in the debt portfolio written down by a material amount, two of which we’ve already discussed.
Based on our outlook for NII, our Board declared monthly distributions of $0.10 per share for January, February and March 2022. And based upon our liquidity forecast and our spillover income levels, our Board also declared a special distribution of $0.05 per share payable in December. We have now declared monthly distributions of $0.10 per share for 63 consecutive months.
BDC Reporter Notes: As we’ve suggested above that last sentence can be regarded as a glass half full or half empty.
We remain committed to providing our shareholders with distributions that are covered by our net investment income over time. Our NAV as of September 30 was $11.63 per share compared to $11.20 as of June 30, 2021 and $11.17 as of September 30, 2020. The $0.43 increase in NAV on a quarterly basis was primarily due to certain portfolio companies closing investment rounds at higher valuations, which drove higher valuation and warrants, our net investment income exceeding paid distributions and accretion from the sale of our shares through our ATM program.
As we’ve consistently noted, 99% of our outstanding principal amount of our debt investments bear interest at floating rates with coupons are structured to increase as interest rates rise with interest rate floors. As of September 30, 100% of our portfolio is at their specific floors.
Questions and Answers
Operator
(Operator Instructions) Our first question is from Sarkis Sherbetchyan with B. Riley.
Sarkis Sherbetchyan B. Riley Securities, Inc., Research Division – Associate Analyst
Just wanted to start off by clearly highlighting the strong origination activity in the third quarter. Maybe any comments on going into the fourth quarter, if you expect that level to continue just kind of given your committed backlog? I know in the release and the recent developments, it seems like the prepayments are kind of outpacing maybe what was disclosed from an origination standpoint. But just want to get your thoughts around that?
Robert D. Pomeroy Horizon Technology Finance Corporation – Chairman & CEO
Yes. A very good question. I think we are definitely experiencing a higher level of prepayment activity. Our portfolio companies have lots of options relative to how they finance their businesses going forward, and we’ve talked about many of them, whether it’s the IPO market being open or a SPAC, obviously debt being part of that and as well as private equity through significant venture capital investments.
So the velocity at which companies are raising money, using their liquidity to develop their products and get those products to market and fund exits is significantly higher than it has historically been. And so that creates both an opportunity for us because I think venture debt has a great place in that kind of menu to basically fill holes in financing strategies that technology, life science companies have nowadays.
So while we do expect higher prepayments and certainly experienced that so far this year and even going into the fourth quarter, we’ve already had a couple. We also see a market that has grown substantially relative to the sizing the venture debt market, which today, we size somewhere around $20 billion to $25 billion.
So when we think about that market size, there is plenty of opportunity in the market to replace those transactions that are paying off and with new deals. And I think our portfolio, probably — from a historical standpoint, probably has relative to how much of the portfolio makes up new deals versus older portfolio.
I think we are on the newer side, where we were able to complete to regularly replace transactions. So we see that continuing. We still see a lot of opportunity we believe that we can continue to grow the portfolio with — and expect to have higher prepayments than we had historically have. And so far, certainly during the course of this year, we have.
And I would just finally mention that we have expanded — our advisor has expanded the platform considerably in terms of number of originators we have in the field, their experience, their knowledge of the market. We think we’re right at the top of the pack relative to that. And I think that also is reflected in our origination capability.
Sarkis Sherbetchyan B. Riley Securities, Inc., Research Division – Associate Analyst
And just kind of thinking through some of the recent releases, I think in September, you had a release where you and Trinity Capital provided a $40 million venture loan to a certain company. I believe that was for Nexii. If you kind of step back and think about potential partnership opportunities or underwriting transactions with potential partners, is this part of the strategy kind of going forward? Would you dip into this more often? Just want to get your thoughts around that?
Robert D. Pomeroy Horizon Technology Finance Corporation – Chairman & CEO
Yes. So historically, that has been. That’s a good catch. That transaction, you got the name right. And we have partnered with a number of lenders that we think are — represent good both competition and partners in the marketplace historically. I don’t — it’s not so much having a specific strategy related to that.
But I think we — our knowledge of the overall market, both the types of companies we’re going after and the competition and potential partners in the market, we look forward is the best transaction for the customer because at the end of the day, we believe that’s going to — that’s what’s going to win the day.
And so we will always talk to and look to participate certain kinds of transactions. It helps manage our concentration risks in our public company portfolio. And so I don’t think there’s any shift there in strategy. We have historically done that if you look back at our history. So we expect that to continue at some level.
Sarkis Sherbetchyan B. Riley Securities, Inc., Research Division – Associate Analyst
Great. One final one for me. I’ll hop back into queue. As you’re looking at the pipeline of opportunities to underwrite debt, clearly you have a pretty good history with some of the existing companies that you’ve underwritten. But as you look at the new companies, any concerns popping up in your mind regarding business models or kind of valuations? Or do you think that there’s plenty of opportunities kind of given the flush liquidity environment?
Gerald A. Michaud Horizon Technology Finance Corporation – President & Director
Well, certainly, the flush liquidity environment can, I think, skew the enthusiasm you have for the market. But I think we’re pretty well grounded in the kinds of transactions that we’re looking at relative to loan to value, we’ll be — basic tenants of underwriting a venture debt transaction. I think we do that as well as anybody in the market, and that’s something that we will continue to do.
As I think Rob mentioned and I may have mentioned well in my opening remarks, we are aware obviously of some of these macro issues relative to supply chain, COVID, hiring all of those issues that are out there that we hear about every day in the market.
And we are regularly — our portfolio managers are regularly in contact with our portfolio companies to see if these particular types of issues are directly impacting those companies. And so we’re certainly trying to stay ahead of that. And certainly, when we’re underwriting new deals, all of those factors come into play as we underwrite the transaction.
Operator
(Operator Instructions) Our next question is from Ryan Lynch with KBW.
Ryan Patrick Lynch Keefe, Bruyette, & Woods, Inc., Research Division – MD
First one I had was you mentioned kind of record levels of venture capital being raised, which we’ve seen high levels for quite a bit of time today. I’m just wondering how does the competitive landscape look from that standpoint because one of the big competitors in your space can be equity capital from BDC going that route versus the debt route.
And on top of that, how has those sort of — those competitive landscape today, how is that potentially impacted the level of prepayments that you guys are experiencing, which obviously are a good thing because you’re getting money back and getting really nice returns on those loans. But obviously, it can present a headwind for portfolio growth, and it is certainly fairly high in the third quarter and look like they’re starting off in the fourth quarter, fairly strong as well.
Robert D. Pomeroy Horizon Technology Finance Corporation – Chairman & CEO
Yes. Good question there. So it’s a double-edged story. Obviously, there’s a substantial amount of venture capital that’s gone into our marketplace. I mean, literally, since we started, Ryan, has grown tenfold. And that has also led to a tenfold growth in venture debt demand as well. So we kind of size our market today around $20 billion to $25 billion relative to venture debt. And so that’s a much bigger market than we historically have.
And so yes, there are — there is more competition in the marketplace from venture debt lenders in terms of new people coming into the marketplace, but it’s a much bigger sized market as well. So we’re seeing plenty of demand there.
As it relates to venture capital, what we’re finding is and this has historically been true that companies today like to augment that venture capital that’s coming into the company with additional debt to basically obviously expand the runway, but also lower the overall cost of capital. This is really important, especially to the entrepreneurs who maybe can give up a little bit less equity in the company as they’re doing that.
Venture capital, for the most part, I’m not saying it never happens. Most part, when venture capital is put into a company, the venture capitalist really don’t want that money going to repay debt. Most of the time when we’re getting repaid, and if you look at the fourth quarter as an example, most of those repayments came — I think all of those repayments came from either M&A activity if our companies went public. So there was an IPO and we got — that we potentially could get paid out from and then potentially SPACs getting done and things like that. That could impact.
And then the last one would be being refinanced by cheaper cost of capital as some of our 4-rated credits have matured and become more bankable. So most of the repayment activity comes from those sources. The venture capital is going into these companies where the velocity of which they’re using their liquidity has also grown quite a bit. So they’re using the money faster. They’re developing their products faster. They’re getting them to market faster, which means they need more liquidity in order to do all of that, and venture debt has a nice, we believe, today, and right now in the market as it sits today, there’s a really nice space for venture debt, and it’s a pretty big space on a comparative basis to our — what it’s been historically.
Ryan Patrick Lynch Keefe, Bruyette, & Woods, Inc., Research Division – MD
Got you. That’s helpful backdrop and commentary on that. As we look at the fourth quarter, $35 million of prepayments already received — in your release, you talked about end of term payments and prepayment fees. Could you quantify what those total, just so we have a sense of what you guys have already received from an income standpoint that was accelerated in the fourth quarter?
Daniel R. Trolio Horizon Technology Finance Corporation – Executive VP & CFO
Yes. So every prepayment is in similar to each quarter is very different. But on average, you can estimate as far as prepayment fees, about 2% to 2.5% end of term payments and other accelerated fees kind of in the 4%, 5.5%. And from there, you can kind of back into the impact of the income for the quarter.
Ryan Patrick Lynch Keefe, Bruyette, & Woods, Inc., Research Division – MD
Okay. That’s helpful. And then just a final one. Are your guys realized and unrealized gains that you guys recognized this quarter, can you just describe kind of what was the main driver behind those? Was it 1 or 2 companies? Or was it a wide variety of companies being written out?
Daniel R. Trolio Horizon Technology Finance Corporation – Executive VP & CFO
Yes, it was both. For realized gains, we had 2 to 3 companies that had events where we realized warrant gains. And then on the unrealized side, there’s a handful of companies that have raised substantial capital at higher valuations that drove our fair value mark for each one of the warrants that we hold.”
CONCLUSION
Undoubtedly, HRZN had a memorable quarter on most every score: with earnings, net assets and activity at very high levels.
Furthermore, roughly half of investment income is dropping to the Net Investment Income line and shareholders continue to receive a very stable dividend and the occasional bonus.
Looking forward, management is making the case that they have the ambition, people and liquidity to continue to grow in the years ahead.
The market is supportive and has pushed up the BDC’s stock price since the pandemic began much more than the sector as a whole, as this chart comparing HRZN to BDCZ shows:
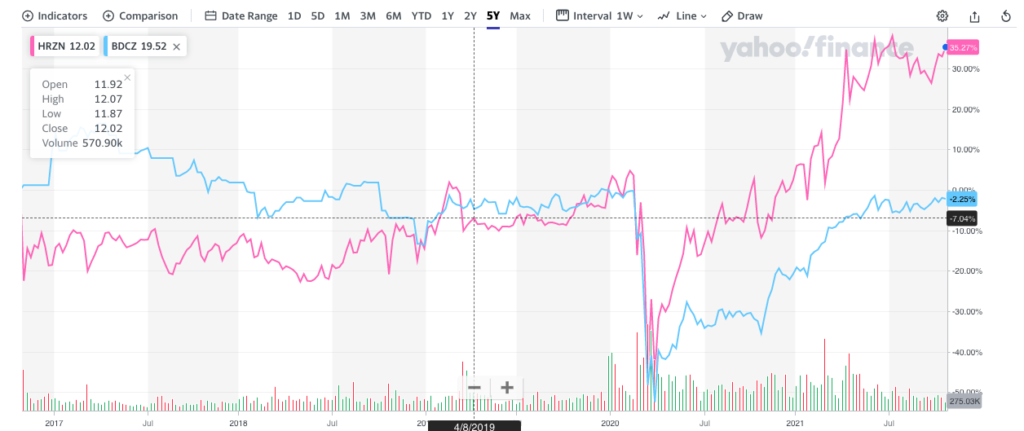
The analyst consensus is for earnings to grow in 2022, up 7.0% to $1.36 per share.
However, with the stock trading at a 50% premium to net book value and with a 12.9x price to future earnings have investors already grabbed all the upside ?
Also, should anything go wrong, either in the venture industry or at the company, isn’t there the risk of a considerable descent from these lofty heights for existing or would -be shareholders ?
Just a move back to net book value would see the stock price by a third. A shareholder would have to wait through 5 years of dividends to make-up for such a price loss.
Already a Member? Log InRegister for the BDC Reporter
The BDC Reporter has been writing about the changing Business Development Company landscape for a decade. We’ve become the leading publication on the BDC industry, with several thousand readers every month. We offer a broad range of free articles like this one, brought to you by an industry veteran and professional investor with 30 years of leveraged finance experience. All you have to do is register, so we can learn a little more about you and your interests. Registration will take only a few seconds.