BDC Common Stocks Market Recap: Week Ended April 29, 2022
BDC COMMON STOCKS
Week 17
Retreat
Last week in this column we provided rhyme and reason as to why most BDCs should perform well in the expected high rate, high inflation environment.
We did wonder, though, “about what might happen to BDC prices for a time should economic and financial conditions darken”.
We worried that BDC investors might bolt – regardless of encouraging fundamentals both in the rear view mirror and peering ahead.
Will there be a similar failure of nerve in the months ahead ? It’s impossible to know, but the chances are relatively high. Historically, BDC price downturns of (10%) or more have occurred on average every two years. Maybe we’re due…
BDC Reporter- BDC Common Stock Market Recap – April 22, 2022
Well, we didn’t have to wait months to find out – just one more week.
BDC sector prices – and all the other major indices – went into a tailspin in the last business week of April.
BDCZ – the UBS Exchange Traded Note which owns most of the BDC stocks – fell (4.20%).
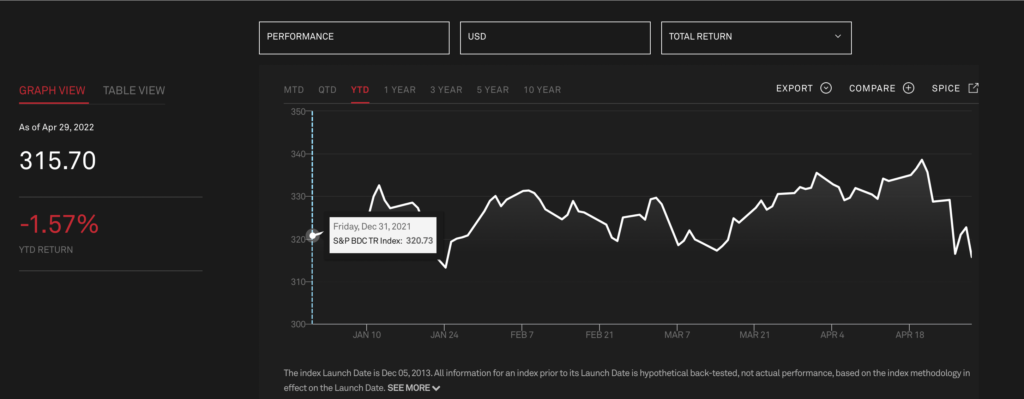
The S&P BDC Index – which calculates results for the sector on a “total return” basis was off (4.5%).
Unfavorable Comparison
This time, the BDC sector performed even worse than the NASDAQ – down (3.9%) – or than the S&P 500 which was off (4.0%).
Truth be told, there was a rout across all markets as any belief in the Fed’s ability to engineer a “soft landing” seemed to go out the window.
Wrong Sort Of Record Breaking
For the BDC sector – going by the price performance of BDCZ – this was the worst week we’ve found in our records since October 2020.
What’s more, BDCZ has now been down for 4 weeks in a row – also something that has not occurred since 2020.
Head Fake
The most remarkable part is that in the middle of all this red ink, BDCZ and other sector indices – reached a new 52 week high ever so briefly on April 21 – just 8 days before.
All that has been washed away this week, with 39 BDCs in the red and only 6 unchanged or in the black.
Down
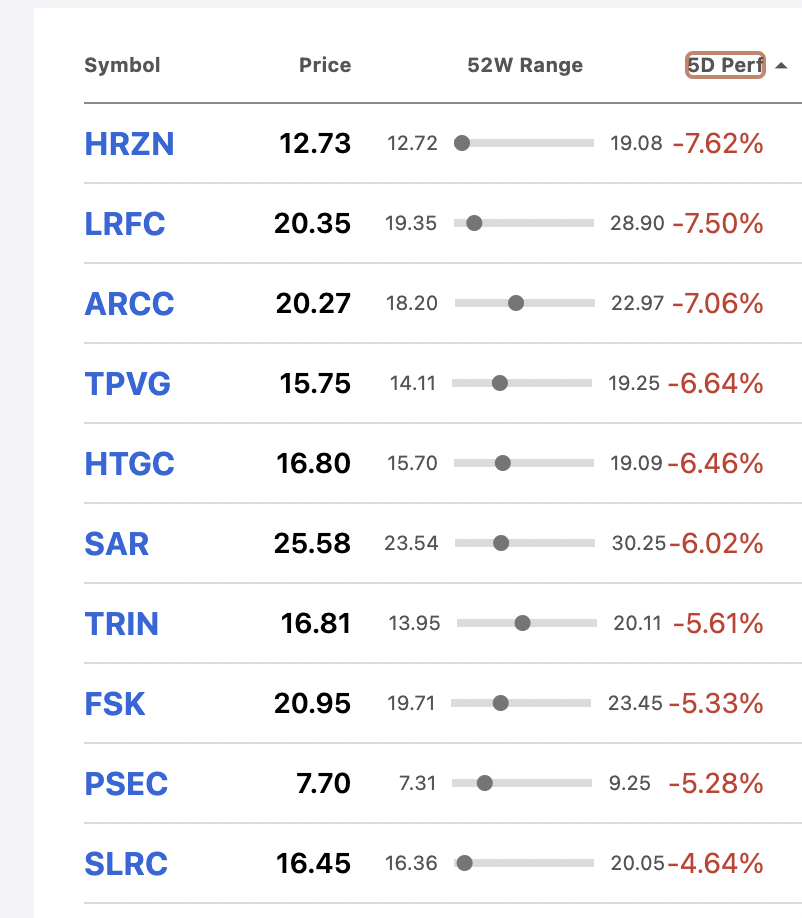
A startling – and unprecedented 24 BDCs – dropped (3%) or more in price in these past 5 trading days.
Here are the top ten, offered up to illustrate both the extent of the sell-off at the extremities and the diversity of BDCs involved – from the largest player to the minnows of this $100bn plus industry.

No Help
Ares Capital (ARCC) – for example – had reported IQ 2022 results, which caused the analyst at J.P Morgan to offer up an “Overweight” buy signal on April 27.
Nonetheless, ARCC dropped (3.3%) on Friday alone, and (7.1%) for the week, despite all but guaranteeing earnings were poised to increase by a double digit percentage on their conference call, as we covered in one of our articles.
Chills
For this week at least – and maybe longer – fundamentals went out the window and fear of a coming recession prevailed.
5 weeks ago – just before the red ink began its run – there were 16 BDCs trading within 5% of their 52 week highs and another 17 within 5%-10%. There were also 20 BDCs with a stock price equal to or greater than its net book value per share – a sign in the mind of some investors of market enthusiasm.
Now, there are only two BDCs within 5% of their 52 week high and 16 in the 5%-10% category. Moreover, the number of BDCs trading above book has dropped to 14.
Perspective
We don’t want too dark a picture because one week – even a terrible one – does not define a sector.
After all, till April 20 of this year, the BDC S&P Index was up 3.1% YTD on a price basis, even while the NASDAQ was off (14%) and the S&P 500 down (6%) in that same period.
On a total return basis, the BDC sector had reached as high as 5.6% at that peak.
As the chart below shows, though, BDC returns are now in the red on a total return basis in 2022, and even more so just on price:

Investors will take some comfort that the S&P calculations indicate that on a 1 year (7.9%), 3 year (9.8&) , 5 year (6.4%) and 10 year (8.5%) annual return basis total returns are still positive.
BDCZ has fallen to its lowest level of 2022, and lines up with where its price was in August 2021.
Finding Meaning
The question, though, is whether the downturn of the last 4 weeks – which accelerated in these last few days – is some sort of “bottom”, or a way station to further depths ?
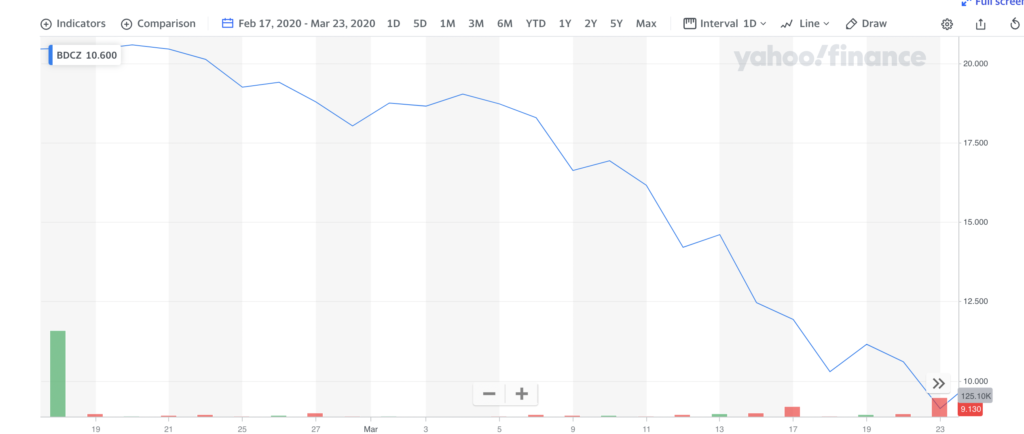
Here is the BDCZ stock price chart for the last time investors believed a recession – or worse – was coming – at the beginning of the pandemic:

BDCZ dropped (55%) in price in just over a month, but was rescued very quickly by the same Fed that is being blamed for the current downturn.
For investors who hung on, BDCZ was back – more or less – at its February 2020 level by June 2021 and even faster when you figure in dividends received (February 28, 2021, using the S&P BDC Index total return chart, just one year later).
Destructive
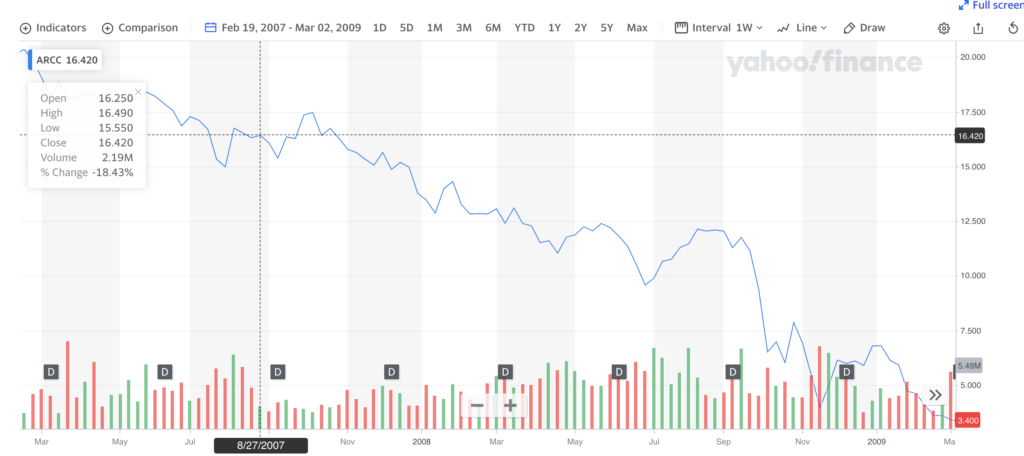
Also instructive – if frightening – is the stock price chart for ARCC before and during the Great Recession. (We use ARCC because neither the S&P nor the BDCZ data goes back that far – but the BDC Reporter does).

In just over two years – and even as ARCC maintained an almost unchanged dividend level – its stock price dropped (85%).
Recessions bring on credit losses, which reduce BDC capital and future earnings power and are always a background concern for the sector because investors – to date – have had an instinctive negative reaction to them.
Bottom Lining
There are two lessons here – in our humble opinion:
First, BDC prices are in danger of dropping much further if investors continue to believe a recession is on its way.
Judging by the financial press; the endless roster of guests on CNBC/Bloomberg pushing that scenario and polls taken of economists and the general public, the prospect of a “hard landing” becomes more likely every day.
This could result in a continuing sell-off of BDC stocks as bearish sentiment takes hold.
Where that ends depends on how this potential recession plays out. Every narrative is different, but all include investors running to the sidelines regardless of underlying BDC performance.
Hold On To What You’ve Got
The second lesson is that BDC prices have always recovered.
As mentioned before, the S&P BDC Index over ten years has achieved a 8.5% annual total percentage return.
That period has included the huge drop in the oil price in mid-2014; recession jitters in 2016 and 2018 and – of course – the pandemic pullback discussed above.
Then there’s 10 year total return data for 25 individual BDCs active over that whole period. A remarkable 24 have posted overall gains and the median gain is 11.0% per annum- which includes both price changes and dividends paid out.
Even over a 5 year period – which includes the 2020 downturn – the Seeking Alpha data shows a median annual gain of 11%.
While we’re on the subject, if your idea of “long term” is 3 years, take comfort from knowing the median annual BDC total return over 36 players in that time frame is 12.3%, despite the pandemic and the last 4 weeks of red ink.
Way Ahead
The next few weeks will be very telling, almost regardless of what happens in earnings season, which enters week two with 22 BDCs reporting. See the BDC Earnings Table.
Most important in the short term will be that “riddle, wrapped in a mystery, inside an enigma” – investor sentiment.
Less oft quoted is what Churchill said at the same time and seems appropriate for what lies ahead for BDC investors: “That which is so dense and secretive as to be totally indecipherable or impossible to foretell”.
Already a Member? Log InRegister for the BDC Reporter
The BDC Reporter has been writing about the changing Business Development Company landscape for a decade. We’ve become the leading publication on the BDC industry, with several thousand readers every month. We offer a broad range of free articles like this one, brought to you by an industry veteran and professional investor with 30 years of leveraged finance experience. All you have to do is register, so we can learn a little more about you and your interests. Registration will take only a few seconds.