BDC Common Stocks Market Recap: Week Ended June 16, 2023
BDC COMMON STOCKS
Week 24
Out Of The Ordinary
Unusually, the streak of weekly BDC sector price increases reached 6 this week.
That sort of streak hasn’t happened for a year.
This keeps the BDC rally going, now up 6.4% since the last Friday we closed in the red – on May 5th.
The Above Notwithstanding…
BDC investor enthusiasm – judging by the 0.3% increase in the BDCZ stock price – was muted.
[BDCZ – for anyone unfamiliar – is the UBS-sponsored note which only holds public BDC stocks and which we use as a sector price guide].BDCZ was up 0.3%, but the price return on the S&P BDC Index was actually (0.9%) in the red this week (and only up 0.6%) over the last fortnight.
The broader indices were up much more this week – and looked more like they truly had their rally hats on:
The S&P 500 was up 2.58%, the NASDAQ 100 3.82%, and even the Dow Jones was up 1.25%.
Better
Still, the BDC metrics we track weekly do reflect a still improving picture, even if only a pale reflection of the more famous indices.
26 BDCs moved up in price (versus 36 last week) and 16 were down.
Of the BDCs in the black price-wise, 6 increased by 3.0% or more.
That was one-third the number in this category compared to last Friday, but there was only 1 BDC that fell (3.0%) plus.
That was Runway Growth – RWAY – down an unexceptional (3.07%) and still in the black in 2023.
Worser
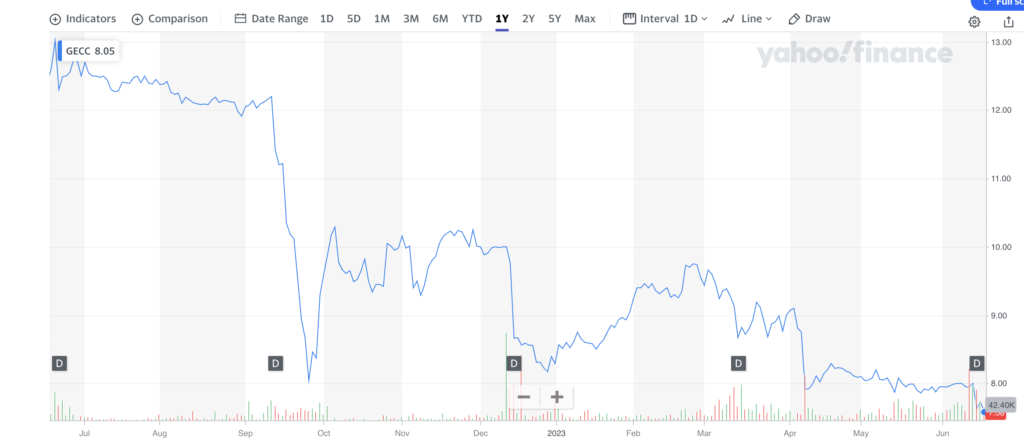
On the more disappointing side, two BDCs reached new 52-week lows this week.
These were Oxford Square (OXSQ) – in the throes of attempting to raise dilutive new equity capital – and Great Elm Capital (GECC).
Here’s the latter’s 12-month stock price chart:
Record
One BDC did reach a new 52-week high: Blackstone Secured Lending Fund (BXSL) at $26.45.
However, these last 52 weeks have generally seen BDC prices depressed.
BXSL remains (30%) below its two-year price level and at its current peak is being valued at just 7.1x 2023 earnings.
Down
Another favorite metric surprisingly weakened this week.
The number of BDCs trading at a price at or above net book value per share dropped from 12 the week before to 11.
(Sorry, we haven’t figured out who the dropout was).
Where We Are
The BDC sector’s price fortunes have revived after falling off a cliff in March due to the failure of Silicon Valley Bank (SVB).
Several weeks of choppy trading in the wake of the California bank’s failure, which saw BDCZ close as low as $15.89 on May 4 – even lower than after SVB – have been replaced by a clear uptrend.
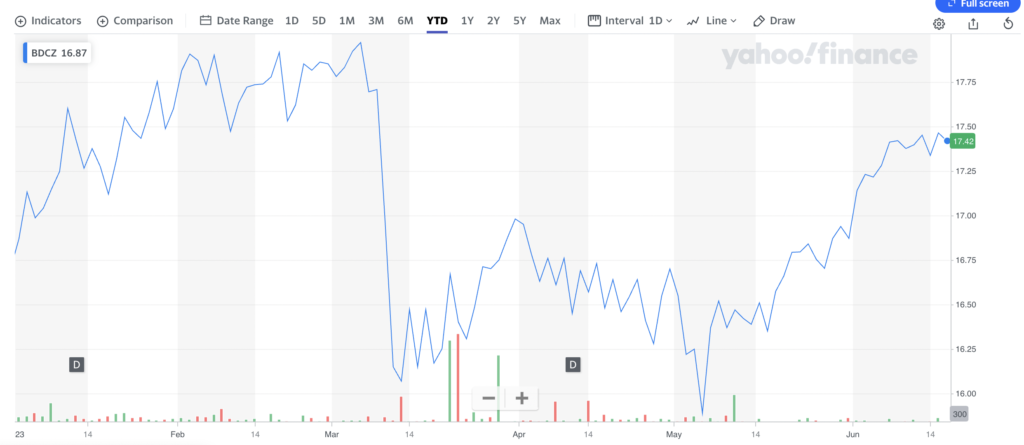
Since May 4 BDCZ has increased 9.6% in price – another reminder of the undeniable volatility of this corner of the market where many investors seem to perpetually have their fingers on the buy or sell button.
This is great for traders who believe they know what lies around the next corner but hard for anyone who checks their BDC prices often, leaving them either distraught by unexpected price slumps or in the grip of Fear Of Missing Out (FOMO).
Anyway, the next big test is to see if BDCZ’s price can return in this frothy market atmosphere to the level reached just before SVB’s sudden collapse soured investors on the sector.
Our View
The BDC Reporter has a proven track record of NOT being able to guess which way the BDC sector or individual BDC stocks will move in the short term.
If only we could…
However, we do remain skeptical that this fifth rally since BDC sector prices last peaked in March-April 2022 is the last one.
As we’ve posited before, there are just too many threats to both the broader markets and the BDC sector itself to allow us to forecast a return to BDCZ’s April 2022 peak of $20.60 without further slumps along the way.
That would take a further 18% price increase and 27% roughly in total from the May 4 2023 low.
Rate Pause
This week, the Fed gave with one hand – pausing interest rate increases at its latest meeting – but strongly suggesting a couple more increases will be headed our way later in the year.
Even more importantly the resilience of core inflation and the Fed’s unrelenting intention to use its rate hike tool to tackle the subject means this historic period of higher rates will last longer than most observers first expected.
Even More
As we discussed last week, that means ever more leveraged companies with debt-heavy balance sheets will be unable to refinance themselves as their loan maturities approach.
For BDCs, this is creating a strange situation where earnings continue to expand as most lenders find a way to keep on paying their interest due even though their debt service coverage has – on average – dropped in half.
However, an ever larger minority of borrowers will trip up and get restructured in and out of bankruptcy, or are liquidated or get sold for less than necessary to ensure full repayment.
This means BDC P&Ls will have to contend with temporarily higher revenues from above-average rates but also permanent loss of income from capital losses.
In the short run, the former will outstrip the latter but in the long run?
Required Reading
When we write the weekly Credit Recap, we’ll show that the credit deterioration carries on across all the different segments of leveraged lending – including BDCs.
Unlike in a typical recession where most of the damage occurs in a very short period, this is a long, grinding process that will play out – even if the economy holds up under the strain – for many quarters.
Only when interest rates drop back to the levels of early 2022 will the pressure relent.
We’ve Only Just Begun
Your guess is as good as ours as to when that happens, but we’re relatively certain that high defaults and record bankruptcies will be with us through the end of 2024 at the very least.
If we’re right about the time frame, the period of credit stress – which began early this year – is only a quarter complete.
What the BDC landscape will look like once these record credit losses have played out is impossible to pre-determine and another reason why we expect BDC investors to re-evaluate appropriate price levels multiple times before we’re done.
[Famous Santayana Quote]
By the way, going by Ares Capital’s (ARCC) stock price chart, almost two years passed between its high in early 2007 and its nadir in March 2009. It took roughly 4 years for the market-leading BDC to trade back even close to its pre-GFC level.
By contrast, the current BDC sector price slump is only just over a year old, yet the level of bankruptcies this year is already attracting comparisons with the Great Recession.
Unfortunately, we believe much more time will need to pass before more “normal conditions” re-appear.
Already a Member? Log In
Register for the BDC Reporter
The BDC Reporter has been writing about the changing Business Development Company landscape for a decade. We’ve become the leading publication on the BDC industry, with several thousand readers every month. We offer a broad range of free articles like this one, brought to you by an industry veteran and professional investor with 30 years of leveraged finance experience. All you have to do is register, so we can learn a little more about you and your interests. Registration will take only a few seconds.