BDC Common Stocks Market Recap: Week Ended June 9, 2023
BDC COMMON STOCKS
Week 23
We’re On
Rally, rally, rally…it’s all we hear.
As this article indicates, since mid-October 2022 NASDAQ is up 32% and the S&P 500 20%.
Even the BDC sector is in rally mode only a few months after crashing in sympathy with Silicon Valley Bank (SVB).
Good. Not Great.
However, the BDC rally since the fall of last year is less spectacular, as this chart comparing BDCZ to the NASDAQ and the S&P 500 shows:
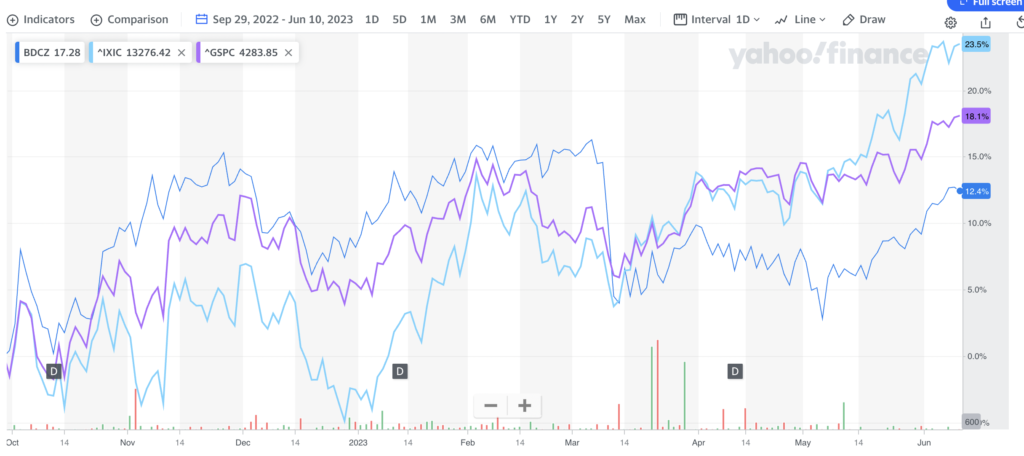
(Of course – as regular readers know – BDCZ is the exchange-traded note which owns most BDC stocks and serves as the sector’s price doppelganger for our purposes).
In fact, BDCZ has not yet returned to its level before the shocking failure of SVB became headline news, while the two broader indices have moved on and not looked back.
Sequential
This is the 5th week in a row that BDCZ is up in price, although the first time the increase was only 0.1%.
The sector is up in 6 of the last 7 weeks and in 9 of the 14 weeks since prices dropped by nearly (10%) because of SVB.
This week, BDCZ moved up 0.8%, which was better than the S&P 500, which moved up 0.4%.
Joining The Party
36 BDCs were in the black and only 6 were in the red.
The most impressive statistic this week to our mind was that 18 BDCs moved up 3.0% or more – the most since mid-January.
Only 1 BDC fell (3.0%) or more this week.
Furthermore – another popular metric with investors (whose popularity we don’t understand) – the number of BDCs priced at or above net book value per share – moved up to 12 from 9 the week before.
Just before the SVB drop, there were 15 BDCs in this category.
Where We Are
BDCZ ended Friday, June 12, 2023, at $17.37, up 3.9% YTD in week 23 of 2023.
During this period 29 BDCs have increased in price, while 13 are still in the red.
Rally Review
Since the BDC sector first dropped from its heights in April 2022 – as markets realized that the financial world was re-setting – there have been 5 periods of decline and recovery.
That’s by our way of looking at this 2-year BDCZ chart below and using 5% closing price movements to determine the minimum cut-off for the ups and downs.
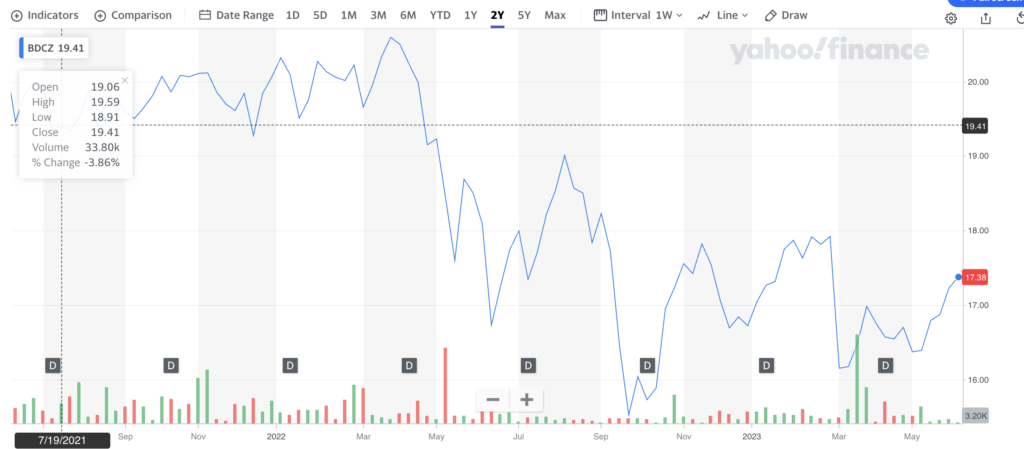
Interestingly, the biggest drop did not occur in the spring of 2022 – down (15%) – but in the fall, when BDCZ fell (18%) following its impressive first rally.
That was followed by another strong rally of 15% that ended in November.
Since then, the price percentage changes upward and downward have been less spectacular.
The latest leg up, which can be measured from the bottom of that cliff which followed the SVB collapse, amounts to 8%
Ways To Go
BDCZ has not yet even returned to the level reached earlier in the year as the fourth rally peaked.
The ETN will have to increase by 3.2% to match the high of February 27, 2023 – just before the prospect of a generalized bank crash swam into view.
Debatable
As with every market rally, there are plenty of nay-sayers about this latest across-the-board price surge.
We are just a few days away from a Fed meeting that could see interest rates increased again, placing more pressure on the financial system; anyone thinking about buying a house and a host of leveraged companies.
Even if the Fed does nothing – the majority view – that will do little to reduce pressure on the parties above given that rate rises to date have been so drastic.
Down The Rabbit Hole
Then there’s the confounding economic data – some of which suggests a slowing economy – or even one in reverse. This week, we heard from Fitch that both global trade and industrial production are “falling sharply” and CNBC reported that jobless claims are at their highest level since 2021.
Yet, there’s also data that leads the like of Goldman Sachs to believe the likelihood of a recession has dropped from 35% to 25%.
Our View
The markets are whistling through the graveyard even as the scope of the real estate downturn comes into focus. This week, delinquent office loans reached a 5 year high.
There’s no end in sight as the Fed’s promise of higher rates for longer guarantees this will be an endemic challenge for months or even years.
Our Bailiwick
Then, there’s the HUGE increase in bankruptcies occurring amongst leveraged companies – a subject we discuss weekly in the Credit Recap.
Here are the January-May 2023 metrics from S&P:
The May filings brought the five-month total to 286 bankruptcy filings, the most since 2010, more than double the filings for the same period in 2022 (138). And it even outran the 262 filings in the same period in 2020 when some companies faced enormous stress. When the oil bust exacted its pound of flesh in 2016, and oil and gas drillers collapsed one after the other, S&P Global recorded 265 filings, but concentrated in oil and gas. To get a higher number of filings than in the first five months of 2023, we have to go back to 2010, when 402 companies filed for bankruptcy during the first five months.
Wolf Street – June 27, 2023
Something New
Most of those bankruptcies reflect the suddenly drastically higher cost of capital rather than the failure of their business models or strategies.
As with real estate, the likelihood that rates – whether the Fed moves the bogey to 5.0%, 5.25%, or 4.75% – will be substantially higher than when the borrowers last arranged their capital strictures is a recipe for ever more restructurings and bankruptcies.
Pain
That’s probably good and necessary for the country and the economy in the long run but in the short run will be very expensive for private equity and a host of lenders – especially those low on balance sheets.
These are not your father’s bankruptcies after all, but something new wrought by the Fed – which has never raised rates quite so fast – to bring interest rates down.
Nightmare Scenario
If we get the collateral damage of a traditional recession where many companies’ EBITDA drops meaningfully, leveraged companies could face a double whammy.
At that point, all bets will be off.
Not So Easy
We hear from many commentators that we may only get a “mild recession” – as if that was something to be pleased about.
However, even a “mild recession” IF the Fed keeps rates high – somewhere north of 2.5% – will be devastating for leveraged companies whose debt service metrics have already been cut in half.
Not Omniscient
We know these are all “maybes” in a sea of “maybes” but should still be cause for thought.
Our view is that while the BDC sector is more resilient than ever before to withstand whatever the Fed and the economy send their way, the current price surge – even if modest – does not reflect what stocks are likely to trade for if the situation darkens.
As we saw in April and August of 2022 and in late February of this year, BDC prices can turn on a dime and fall by monumental percentages.
To our mind, the all-clear has not yet sounded in this brave new world the Fed has fashioned since early 2022.
Neither BDC stocks – or Baby Bonds for that matter – are safe from a sixth change of heart.
Already a Member? Log In
Register for the BDC Reporter
The BDC Reporter has been writing about the changing Business Development Company landscape for a decade. We’ve become the leading publication on the BDC industry, with several thousand readers every month. We offer a broad range of free articles like this one, brought to you by an industry veteran and professional investor with 30 years of leveraged finance experience. All you have to do is register, so we can learn a little more about you and your interests. Registration will take only a few seconds.