BDC Common Stocks Market Recap: Week Ended September 29, 2023
BDC COMMON STOCKS
Week 39
Unusual
This is something you don’t see every day.
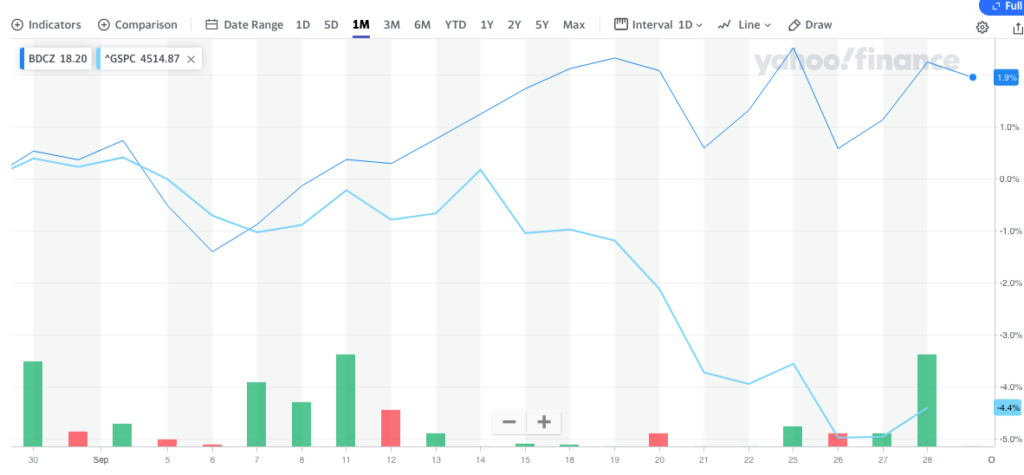
Typically, the prices of the S&P 500 index and the BDC sector move largely in sync.
However, this week the former fell (0.7%) while the latter moved up 0.7%.
This has been happening all month as shown below, and the gap is pretty wide with the S&P down (4.4%) and BDCZ – the exchange-traded note which owns most BDC stocks – up 1.9%.
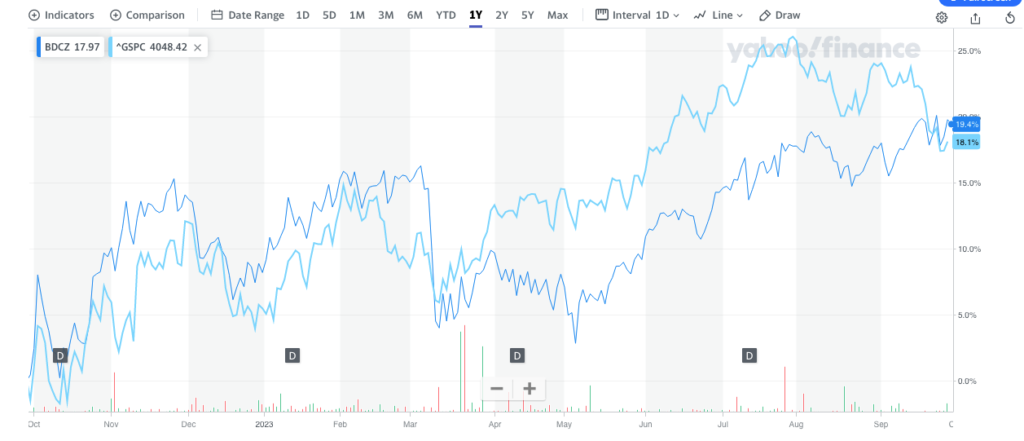
To make our point, look at the 1 year chart, and how close the S&P 500 and BDCZ move:
Carry On
While investors in the broader market have begun to worry about the long-term impact on earnings of the Fed’s interest rates, BDC investors remain chipper.
BDCZ is close to its 52-week high and the S&P BDC Index on a “total return” basis is only (0.3%) off its all-time peak.
This week, 23 BDCs increased in flat or remained unchanged, with 4 up 3.0% or more.
On a 2023 year-to-date basis, 34 BDCs are up in price, leaving only 8 in the red – a pretty broad rally.
As of Friday, September 29 – end of the month and the quarter – 10 BDCs are trading within 5% of their 52-week high price and another 16 between 5% and 10%.
(By contrast, only 3 BDCs are priced within 10% of their 52-week lows).
Prospects
Can the BDC sector do better?
Obviously, we don’t know but years of preparing these metrics does suggest there’s still room for improvement.
At the moment, only 12 BDCs are trading at or above net book value per share.
At prior rally peaks, we’ve seen that metric increase to 20-21.
BDCZ remains (10.4%) below its highest post-Covid price level set in 2022 even while posting materially higher distributions than before.
Finally, BDCZ will need to increase by nearly a third to match its all-time high price set in 2017.
Look Out
Much will depend on factors outside the control of BDC managers – principally the level of short-term interest rates.
Of late, the buoyancy in BDC prices – probably – has much to do with the realization amongst investors that “higher for longer” is a formula for reaching and maintaining record earnings and distributions.
As we’ve been saying for some time, the BDC sector may not have yet reached “peak earnings”, which we anticipate might not arrive till the IIQ 2024, or even beyond.
Also, many BDCs are storing up undistributed earnings as never before, ensuring strong distribution levels into 2025 at the very least.
More subtly, many BDC managers appear to be pulling back from maximizing their portfolio size, leaving themselves room for AUM growth in the future which will support their earnings power even when the Fed relents and starts reducing rates.
As the BDC Credit Table shows, IIQ 2023 was the first quarter in two years that the sector’s AUM dropped.
BDC managers will say they are “being conservative” but – in our view – what they’re conserving is firepower at a time when returns on equity are very high even at modest levels of leverage.
Already a Member? Log In
Register for the BDC Reporter
The BDC Reporter has been writing about the changing Business Development Company landscape for a decade. We’ve become the leading publication on the BDC industry, with several thousand readers every month. We offer a broad range of free articles like this one, brought to you by an industry veteran and professional investor with 30 years of leveraged finance experience. All you have to do is register, so we can learn a little more about you and your interests. Registration will take only a few seconds.