BDC Common Stocks Market Recap: Week Ended January 26, 2024
BDC COMMON STOCKS
Week 4
Forging Ahead
In this last full week of the first month of 2024, the BDC sector kept on keeping on.
The S&P 500, which reached a new 52-week high this week, was up 1.1% but the BDC sector – as measured by the sector exchange-traded note with the ticker BDCZ – was up 1.6%.
The S&P BDC Index – another measuring stick we favor – was up 1.1% on price terms and 1.6% on a “total return” basis.
Among the 43 BDCs we track, 36 increased in price or were unchanged and 7 were down.
Reflecting the “bullish” conditions, 11 of the BDCs up in price increased by 3.0% or more.
Sidebar
Funnily enough, the BDC with the biggest percentage price increase this week was TriplePoint Venture Growth (TPVG) – a venture debt lender whose net asset value per share dropped by (12.7%) in the first 9 months of 2023 – the worst performance of any BDC.
Since 11/15/2021, TPVG’s stock price has been in freefall – off more than (50%) at its lowest point on 10/20/2023, when a price of $9.20 was reached.
However, nothing goes down forever, and since that nadir was reached TPVG has increased by 25%, including this week’s jump.
Still, TPVG has another 65% upward price climb to match its late 2021 peak.
The BDC’s price descent might resume, though, if credit losses continue to mount. We have no unique insights as to whether they will or won’t, but the Great Pullback in the venture eco-sphere continues, and that might be bad news for TPVG.
Full Throttle
We’re still in the midst of a red-hot BDC rally.
If we go back to the very beginning of this rally – generally agreed to be the “very best place to start” – the S&P BDC Index on a price basis has increased by 27% since September 30, 2022, when the sector hit rock bottom in this cycle.
On a “total return” basis, the sector is up 47% over this same 16-month period – a 35% annual return.
More recently – and included in the results above – the S&P BDC Index on a price basis is up 3.2% YTD after 4 weeks and 3.4% on a “total return” basis.
Speaking of the latter, that index is once again at an all-time high.
Performance
Over ten years, the annual return you’d have achieved by buying and holding this index is a lackluster 7.1% per annum.
However, if you began 5 years ago, kept your head down, and ignored multiple threats – some real and most imaginary – the annual total return comes to double digits: 11.5%.
Most rewarded of all are the Johnny and Janets come lately who’ve achieved a 15.8% annual return.
Outlook
It’s not clear what all this historic return data tells us about what will happen in the months and years ahead.
Over at our sister publication – BDC Best Ideas – we’re projecting double-digit percentage “total returns” for most BDCs over the next 5 years, even though the sector has – or will shortly – reach peak earnings and distributions.
However, those gains are likely to occur within a highly volatile context.
Or, put another way, at BDC Ideas we expect to see BDC prices go up and down considerably in the years ahead even if – ultimately – they will move higher.
Topping?
In the short run – with 20 BDCs trading within 5% of their 52-week highs (and 5 hitting new records this week) and another 10 only 5%-10% off their highs – it’s hard to imagine the sector climbing much higher.
On the other hand – and as we’ve discussed on these pages – recent analyst advice about BDC stocks getting oversold appears to have fallen on deaf ears.
Been Done Before
This reminds us of how the markets behaved in the aftermath of the Covid crisis:
First, BDC prices fell hugely in March 2020 on the prospect of a global, pandemic-caused recession.
It was the fastest and sharpest drop in BDC history, exceeding in its velocity what happened in the GFC.
However, investors jumped back in within a month as governments made clear they would pump limitless monies into the economy.
That return, though, happened gradually and lasted from April 2020 to about June 2021 as more and more investors became convinced that all would be well.
Then from the summer of 2021 to the spring of 2022, the sector plateaued at a level very close to where this all began pre-pandemic.
Finally, the invasion of Ukraine and – more importantly – the fear that the Fed would crash land the economy by raising rates caused another drop in BDC prices – less severe than in the early days of the pandemic – but still a (25%) drop that lasted 6 months – to September 2022.
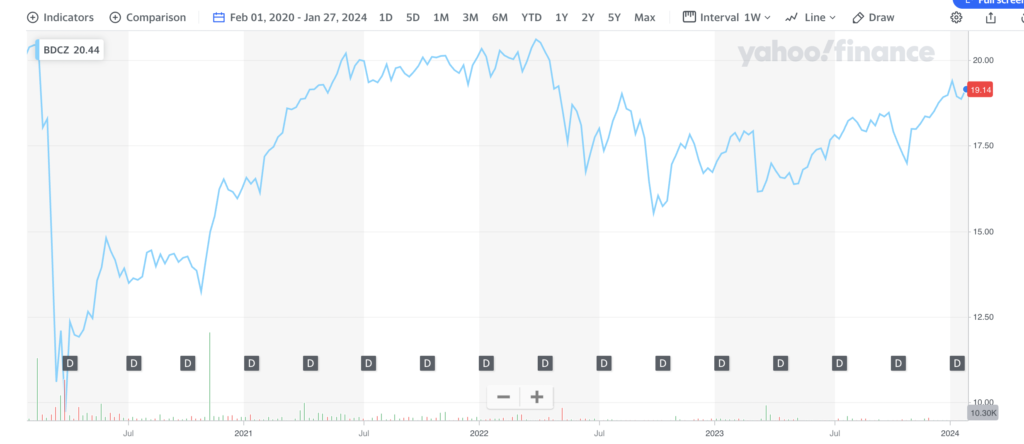
At this point, we’re very likely close to where we were in June 2021 with just about everyone who had decamped earlier having returned to the BDC fold.
Even if BDC prices tread water from here, the sector could still generate a mid-teens total return for an indefinite time to come.
As always, the greatest threat to the BDC sector is a sudden revived belief in the zeitgeist – like in March 2020 and April 2022 – that a recession is in the cards.
At the moment, though, economic metrics could barely be better, the Fed Funds rate remains at its highest level boosting BDC earnings, and credit conditions are mild. (Look for an upcoming credit review from the BDC Reporter for January 2024).
However, we’ve learned to expect the unexpected, and sentiment could turn on a dime, so we’ll remain vigilant.
Already a Member? Log In
Register for the BDC Reporter
The BDC Reporter has been writing about the changing Business Development Company landscape for a decade. We’ve become the leading publication on the BDC industry, with several thousand readers every month. We offer a broad range of free articles like this one, brought to you by an industry veteran and professional investor with 30 years of leveraged finance experience. All you have to do is register, so we can learn a little more about you and your interests. Registration will take only a few seconds.