Palmer Square Capital BDC: First Look – Part I of II – CORRECTED VERSION
MISTAKE: Mea Culpa. As we were writing Part II of this series, we realized that we had made a mistake in Part I where the BDC’s management fee is concerned. Here is a copy of the correction we made:
CORRECTION: We initially wrote, “Following the IPO, the manager will charge an annual Management Fee (MF) of 1.75% of assets.” We should have written “1.75% of net assets”. We initially said, “The MF is very standard in the BDC space”. What we should have written is that PSBD is taking a leaf out of MidCap Financial’s book, which in 2022 was the first BDC to charge a management fee based on its net book value level”. According to the Prospectus, this formula will result in a lower management fee than on the traditional percentage of assets basis:
Our fee structure is lower than most externally-managed, publicly-traded BDCs. At our target debt-to-equity ratio of 1.40x to 1.50x, the base management fee payable to our Investment Advisor would represent approximately 0.70% of our gross assets and is payable at a rate of 1.75% of our net assets. In comparison, as of September 30, 2023, base management fees among externally-managed, publicly-traded BDCs (other than venture lenders) with a market capitalization of greater than $500 million were generally payable at a rate of 1.00% to 2.00% of gross assets (excluding cash and cash equivalents), or between 1.75% and 4.02% of net assets.
NEWS
As discussed yesterday, several BDCs have undertaken – or are on the brink – of going public through an initial public offering (IPO).
On January 17, 2024, Palmer Square Capital BDC (PSBD) priced its initial public offering of 5,450,000 shares of its common stock at $16.45 per share, for anticipated gross proceeds of approximately $89.7 million.
Here is a link to the press release and to the BDC’s Prospectus, published on its website on January 18, 2024.
Unfortunately, we were not able to get access to the Investor Presentation which preceded the IPO.
ANALYSIS
Getting Up To Speed
The BDC Reporter had zero prior familiarity with the BDC or its parent Palmer Square Capital Management (PSCM), a privately held asset manager, based in Kansas City.
As a result, we’ve undertaken what research we can in a short period to provide this first look at the new BDC. This included reviewing the press release; Prospectus, the most recent 10-Q for the quarter that ended September 30, 2023, and the 10-K filings for 2021 and 2022.
We are breaking up our work into two parts. In this first article, we’re just providing the key facts would-be investors might want to know about PSBD. Not to weigh our readers down, we’ll publish a Part II where we offer our views on the strengths, weaknesses, and question marks we’ve found in pulling together this review.
First Launched
PSBD was organized as a Maryland corporation on August 26, 2019, but did not commence operations until January 23, 2020.
Initial Capitalization
In the first active quarter of 2020, the BDC issued and sold 11,383,139 shares at an aggregate purchase price of $217.5 million, and by the end of IQ 2020 already had $469mn in portfolio assets and a Net Asset Value Per Share of $16.16. All the initial capital and subsequent capital raises – until Wednesday’s IPO – were in the form of private offerings.
Total Equity Raised
Overall – before the IPO – the BDC raised $445mn from its shareholders.
Portfolio Growth
In the roughly four years since its launch, the BDC has grown fast. At the end of 2020 portfolio assets were $653mn, $1.194bn in 2021; $1.017bn in 2022, and $1.105bn as of September 30, 2023.
Manager
The external manager of the BDC is Palmer Square BDC Advisor LLC, a majority-owned subsidiary of PSCM and an
investment adviser registered under the Investment Advisers Act of 1940.
Compensation Arrangements
CORRECTION: We initially wrote, “Following the IPO, the manager will charge an annual Management Fee (MF) of 1.75% of assets.” We should have written “1.75% of net assets”. We initially said, “The MF is very standard in the BDC space”. What we should have written is that PSBD is taking a leaf out of MidCap Financial’s book, which in 2022 was the first BDC to charge a management fee based on its net book value level”. According to the Prospectus, this formula will result in a lower management fee than on the traditional percentage of assets basis:
Our fee structure is lower than most externally-managed, publicly-traded BDCs. At our target debt-to-equity ratio of 1.40x to 1.50x, the base management fee payable to our Investment Advisor would represent approximately 0.70% of our gross assets and is payable at a rate of 1.75% of our net assets. In comparison, as of September 30, 2023, base management fees among externally-managed, publicly-traded BDCs (other than venture lenders) with a market capitalization of greater than $500 million were generally payable at a rate of 1.00% to 2.00% of gross assets (excluding cash and cash equivalents), or between 1.75% and 4.02% of net assets.
The Incentive Fee (IF) has a “look-back” feature – typically a shareholder-friendly item – but it only relates to realized losses, and going back a maximum of twelve quarters. We strongly suggest reading the Prospectus to understand the mechanics of both fees. See pages 11-12 for a summary and 91-96 for the full explanation.
Strategy
Here is how the Prospectus defines the BDC’s strategy:
Our current investment focus is guided by two strategies that facilitate our investment opportunities and core competencies: (1) investing in corporate debt securities and, to a lesser extent, (2) investing in collateralized loan obligation structured credit funds, or “CLOs”, that typically own corporate debt securities, including in the equity and junior debt tranches of CLOs. We may also receive warrants or other rights to acquire equity or similar securities or otherwise purchase such securities in connection with making an investment in a company.
Palmer Square Capital BDC Prospectus – Page 1
In regards to i)the focus is on investing in liquid loans to very large borrowers, typically in a first-lien position. Borrowers are said to have a weighted average over the last twelve months’ earnings before interest, taxes, depreciation, and amortization (“EBITDA”) of $448 million, weighted average loan size of $1,369 million, weighted average interest coverage of 2.3x and weighted average first lien leverage of 5.3x. As of September 30,
2023, the portfolio was comprised of 82.50% of first-lien senior secured debt, 5.36% of second-lien senior
secured debt, 0.13% in corporate bonds, 3.00% in CLO securities, and 9.01% in short-term investments.
The parent has considerable experience sponsoring and investing in the CLO market which accounts for strategy ii).
The BDC has borrowers both in the U.S. and abroad.
Perceived Opportunity
We believe broadly-syndicated fixed and floating rate loans and corporate debt
Palmer Square Capital BDC Prospectus – Page 3 – Highlights ours
provide an opportunity to achieve attractive, risk-adjusted returns, including through NAV growth from
current porfolio market price improvement and total return opportunities for broadly syndicated loans.
Specifically, the investment team of our Investment Advisor, or the “Investment Team”, believes it can
mitigate risk and achieve our investment objective by: (i) seeking the best relative value, which may equate to
buying new loans or other corporate debt issuances at a discount or purchasing them in the secondary market,and (ii) seeking to buy loans or other corporate debt issuances that the Investment Team believes have strongfundamentals, low default risk and are capable of withstanding significant downward pricing pressure.
Management also believes the market for leveraged loans is expanding and there is decreased competition from banks. Finally “The Investment Team believes that CLO equity and debt have been a significant source of returns for investors historically, and have the potential to offer investors high cash on cash returns with low credit risk and low correlation to traditional asset classes”.
Number Of Loans/Borrowers
As of September 30, 2023, the BDC had 219 debt and equity investments in 184 portfolio companies. This is similar to the metrics for 2021 and 2022.
To date, the BDC has invested $2.2bn, roughly twice the current value of the portfolio.
Investment/Portfolio Yield
According to the Prospectus, as of September 30, 2023, the weighted average total yield to maturity of debt and income-producing securities at amortized cost was 9.67%.
Team/Experience
As of September 30, 2023, the investment team at the BDC was comprised of 28 investment professionals, “all of whom dedicate a substantial portion of their time to the Company”. In addition, the team has eight dedicated operations professionals.
The parent – PSCM – is a Delaware limited liability company formed in 2009 and had approximately $27.7 billion in
assets under management as of September 30, 2023, with approximately $3.2 billion in assets under
management in opportunistic strategies (which includes the BDC), approximately $3.3 billion in assets under
management in income/short-duration strategies and approximately $21.2 billion in assets under management in
private credit/structured credit issuance strategies. PSCM has 56 professionals, 28 of whom are “investment professionals”.
The BDC’s Chairman and CEO is Christopher Long, founder and Chairman of the parent. The CIO is his spouse Angie Long. For the rest of the senior team and the names and resumes of the directors, see pages 80-87.
Not uncommonly, the BDC has NOT appointed a “lead independent director”. Furthermore, the Board has agreed that the external manager will value the portfolio assets quarterly. In the Risks section, this conflict of interest is noted. Even when an outside firm is engaged to value an asset, the final say is left to the external manager.
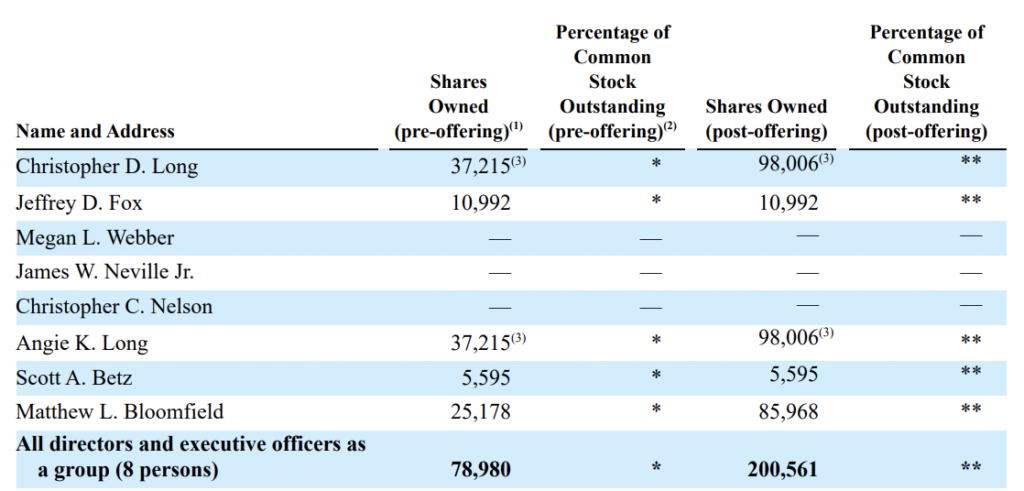
Manager And Director Ownership
After the IPO – and before for that matter – several employees and directors have no – or very modest – investments in the stock of the BDC:
Borrowing
The BDC is currently financed by two secured Revolvers from Bank America and Wells Fargo.
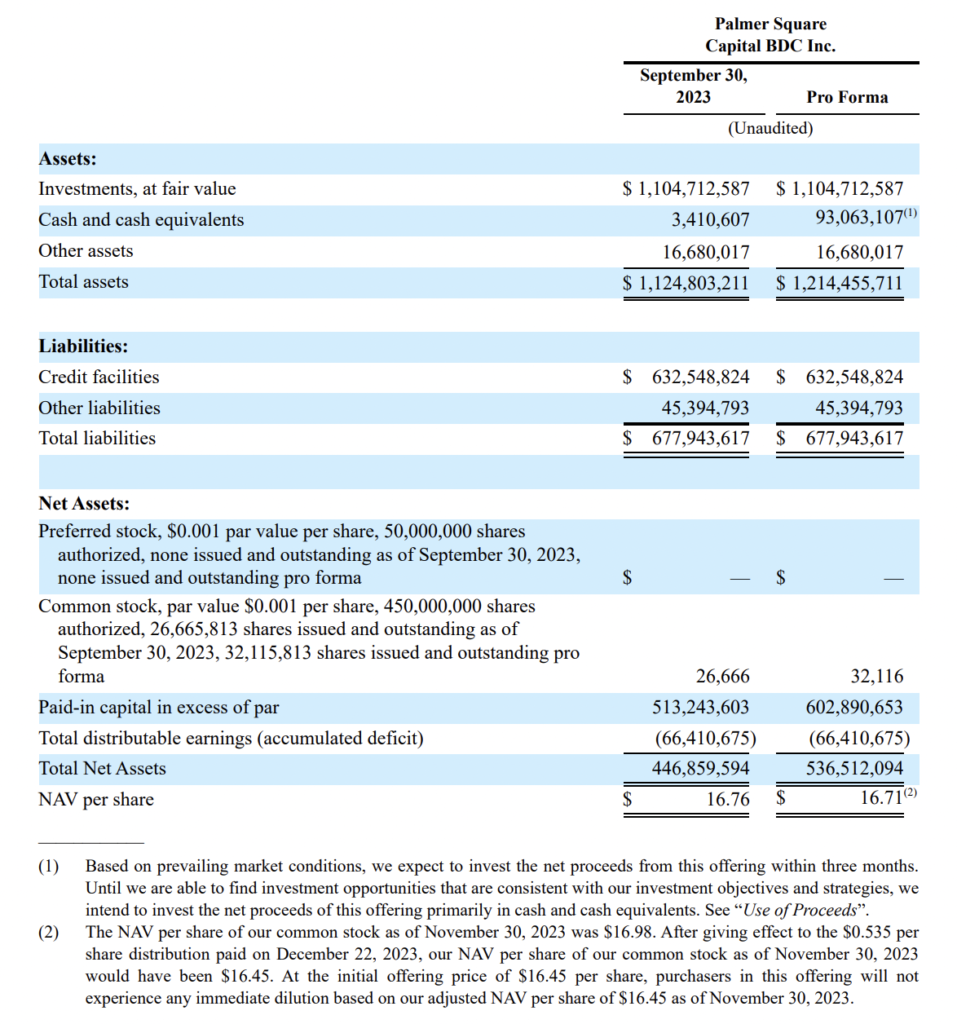
Capitalization
Target Leverage
We get the impression management is targeting debt-to-equity of 1.45-1.50 to 1.00. As of September 30, 2023, though, the debt-to-equity ratio was 1.23x by our calculation.
Asset coverage was 171% in September 2023 but only 157% at the end of 2022 and 170% in 2021. The regulatory minimum is 150%.
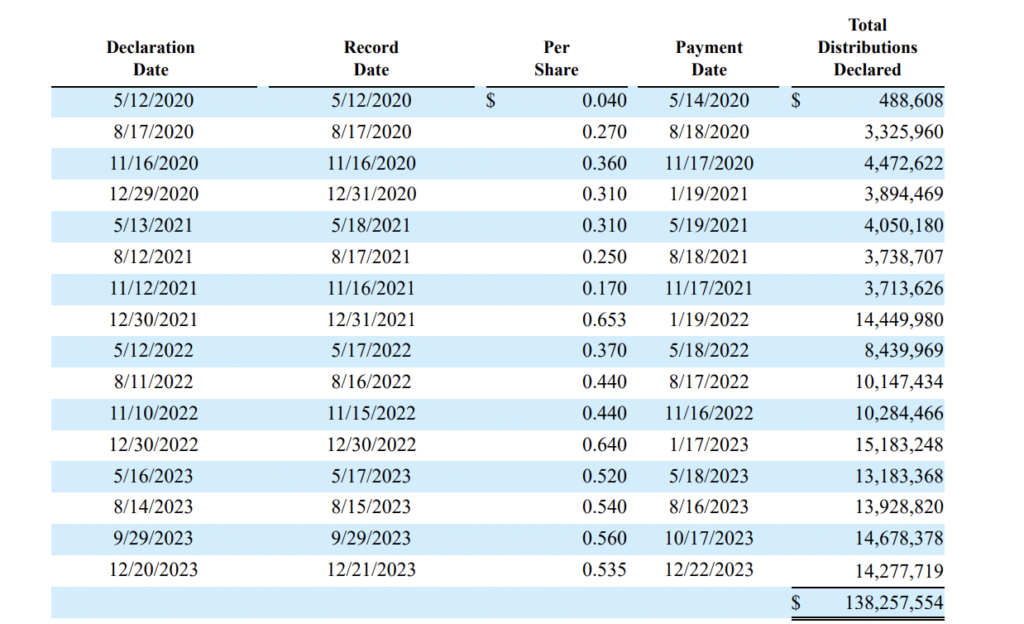
Distributions
Here are all the distributions made by the BDC since inception. However, we do not know what the first distribution will be now the BDC is public.
Financial Performance
Here is the BDC’s 2023 performance for the most recent quarter and 9 months of 2023, compared to the same periods in 2022.
| For the Three Months Ended September 30 | For the Nine Months Ended September 30 | |||
| 2023 | 2022 | 2023 | 2022 | |
| Income: | ||||
| Investment income from non-controlled, non-affiliated investments: | ||||
| Interest income | $ 27,323,754 | $ 19,718,478 | $ 78,943,113 | $ 50,266,810 |
| Dividend income | 1,297,090 | 223,816 | 3,115,974 | 278,529 |
| Other income | 152,846 | 31,260 | 341,968 | 180,415 |
| Total investment income from non-controlled, non-affiliated investments | 28,773,690 | 19,973,554 | 82,401,055 | 50,725,754 |
| Total Investment Income | 28,773,690 | 19,973,554 | 82,401,055 | 50,725,754 |
| Expenses: | ||||
| Interest expense | 11,500,504 | 7,015,768 | 32,697,517 | 14,595,014 |
| Management fees | 2,197,758 | 2,000,103 | 6,155,999 | 6,455,899 |
| Professional fees | 143,560 | 184,698 | 562,835 | 463,115 |
| Directors fees | 18,904 | 18,904 | 56,096 | 56,096 |
| Other general and administrative expenses | 383,771 | 551,655 | 1,101,395 | 1,290,075 |
| Total Expenses | 14,244,497 | 9,771,128 | 40,573,842 | 22,860,199 |
| Less: Management fee waiver (Note 3) | (274,720) | (250,013) | (769,500) | (806,987) |
| Net expenses | 13,969,777 | 9,521,115 | 39,804,342 | 22,053,212 |
| Net Investment Income (Loss) | 14,803,913 | 10,452,439 | 42,596,713 | 28,672,542 |
| Realized and unrealized gains (losses) on investments and foreign currency transactions | ||||
| Net realized gains (losses): | ||||
| Non-controlled, non-affiliated investments | (2,103,618) | (496,697) | (2,423,632) | (1,353,321) |
| Total net realized gains (losses) | (2,103,618) | (496,697) | (2,423,632) | (1,353,321) |
| Net change in unrealized gains (losses): | ||||
| Non-controlled, non-affiliated investments | 21,152,793 | (16,711,415) | 45,708,992 | (102,837,812) |
| Total net change in unrealized gains (losses) | 21,152,793 | (16,711,415) | 45,708,992 | (102,837,812) |
| Total realized and unrealized gains (losses) | 19,049,175 | (17,208,112) | 43,285,360 | (104,191,133) |
| Net Increase (Decrease) in Net Assets Resulting from Operations | $ 33,853,088 | $ (6,755,673) | $ 85,882,073 | (75,518,591) |
| Per Common Share Data: | ||||
| Basic and diluted net investment income per common share | $ 0.57 | $ 0.45 | $ 1.68 | 1.25 |
| Basic and diluted net increase (decrease) in net assets resulting from operations | $ 1.30 | $ (0.29) | $ 3.39 | (3.29) |
| Weighted Average Common Shares Outstanding – Basic and Diluted | 26,016,761 | 23,214,683 | 25,359,324 | 22,986,437 |
We would not rely heavily on historical results because the economics of the BDC will change on going public with the charging of the Incentive Fee; the expenses of being public and the hard-to-handicap impact of the new capital and assets.
There are no loans on non-accrual.
However, the total portfolio is valued at a discount of (5%) of cost.
Already a Member? Log In
Register for the BDC Reporter
The BDC Reporter has been writing about the changing Business Development Company landscape for a decade. We’ve become the leading publication on the BDC industry, with several thousand readers every month. We offer a broad range of free articles like this one, brought to you by an industry veteran and professional investor with 30 years of leveraged finance experience. All you have to do is register, so we can learn a little more about you and your interests. Registration will take only a few seconds.