BDC Common Stocks Market Recap: Week Ended March 28, 2024
Premium FreeBDC COMMON STOCKS
Week 13
Tied Up
The month and the quarter – all thirteen weeks – ended neatly on this holiday-shortened week on Thursday March 28, 2024.
Where BDC stocks were concerned, we got the sense that there was a degree of re-balancing and portfolio tidying going on given the calendar.
BDCZ – the UBS-sponsored exchange traded note which we use every week to measure sectoral price movements, increased 2.7%.
For a change, the BDC sector’s percentage price increase was greater than the S&P 500, which only went up 0.3%.
Very Good
Anybody who invests in the S&P 500 (or any of the major indices for that matter), though, has nothing to complain about where 2024 YTD is concerned. Here’s an extract from a CNN article on the subject:
The S&P 500 notched 22 new highs in the first three months of 2024 alone, and the Dow is just points away from reaching the key threshold of 40,000 for the first time ever.
For the quarter, the S&P 500 is about 10.2% higher, its strongest first quarter since 2019. The Dow is up 5.6% – its strongest first quarter since 2021. The Nasdaq, meanwhile, gained more than 9%.
CNN – Nicole Goodkind – March 28, 2024
Not So Much
By contrast – and even with this week’s price surge – the BDC sector has not kept up with the major indices.
BDCZ is up 3.0% for the quarter.
If we look at the S&P BDC Index on a total return basis, the sector is up 6.0%. To compare apples with apples, the S&P 500, including dividends, increased 10.6%.
BDC investors probably shouldn’t look a gift horse in the mouth. After all, a 6.0% total return in 3 months is nothing to sneeze at but does lag the S&P 500 by (43%).
Granular
Anyway, averages can be misleading so let’s look at how individual BDCs have performed this week and this quarter.
As you’d imagine, given the end of quarter burst of speed, most BDCs were in the black over the last 4 days.
36 BDCs increased in price – the highest number in a week since January 26, 2024.
Furthermore, 7 BDCs increased 3.0% or more in price – also the biggest number in this category since January 26, 2024.
Bit Of Both
A little less impressively for a BDC sector nominally still in rally mode, in the year-to-date period 26 BDCs can boast a higher price in 2024 than at the end of 2023, but that leaves 16 in the red.
Looking at the glass in a half-empty way, 2024 has seen many individual BDC stocks punished by the market.
To be specific, 11 BDCs are down by (3.0%) or more in price, including 5 off by (10%) or more.
The most out of favor stocks from worst down – going by their tickers – are: OFS, HRZN, TPVG, ICMB and SAR.
Same
Those BDCs operate in different segments of the leveraged loan market – lower middle market (OFS,SAR); middle market (ICMB) and venture investing (HRZN,TPVG).
What they have in common – as you can see by reviewing the BDC Summary Results Table for the IVQ 2023 – is that all under-performed investor expectations where their most recent results are concerned.
Admittedly, all but SAR have been underperforming for some time, both in credit terms and where the erosion of their net book value is concerned.
Not Used To This
SAR – by contrast – has been one of the best performers in the BDC sector in recent years till a modest mis-step in their most recent quarter ended November 2023.
As the BDC’s manager made clear on its latest conference call, they regard this as an aberration
…our historical NAV per share…has increased 20 of the past 27 quarters with Q3 down $1.02 per share primarily reflecting the markdowns discussed. Over the long term, our net asset value has steadily increased since 2011, and this growth has generally been accretive, as demonstrated by the consistent increase in NAV per share over the long term.
Saratoga Investment Earnings Conference Call January 10, 2024
Let’s Not Forget
Also swooning in price in 2024 have been other recent underperformers, including some very large BDCs such as FS-KKR Capital (FSK); BlackRock TCP Capital (TCPC) and Prospect Capital (PSEC).
Thumbs Up
From a glass half full perspective, 5 BDCs shot up 10% or more in price in 2024 YTD, principally on the back of (continued) superior financial performance.
Here are the tickers of this year’s over-achievers from top down: BXSL, HTGC, OXSQ, GBDC and MAIN.
All of these BDCs – with one notable exception – booked higher net book value per share (NAVPS) in 2023 over 2022. MAIN justified its consistently high price by boosting its NAVPS even while jacking up its distributions by 25%.
The exception mentioned is OXSQ – Oxford Square Capital – whose NAVPS dropped (8%), yet attracted some investor interest.
We can’t really explain OXSQ apparent popularity in 2024 to date given that the BDC announced a new non-accrual in the IVQ 2023; has seen (66%) of its NAVPS disappear over the last 5 years and has not changed its monthly distribution in 4 years.
Looking Forward
As we peer into the 9 remaining months of the year, we continue to expect BDC earnings to stay high and distributions to plateau, or nudge up slightly – notwithstanding an ever more likely (0.25%) Fed Funds rate reduction in June or July.
(The Core PCE inflation number was published on Friday at a level heaven-sent to allow Chairman Powell to begin a gradual descent from sky-high interest rates in the second half of the year).
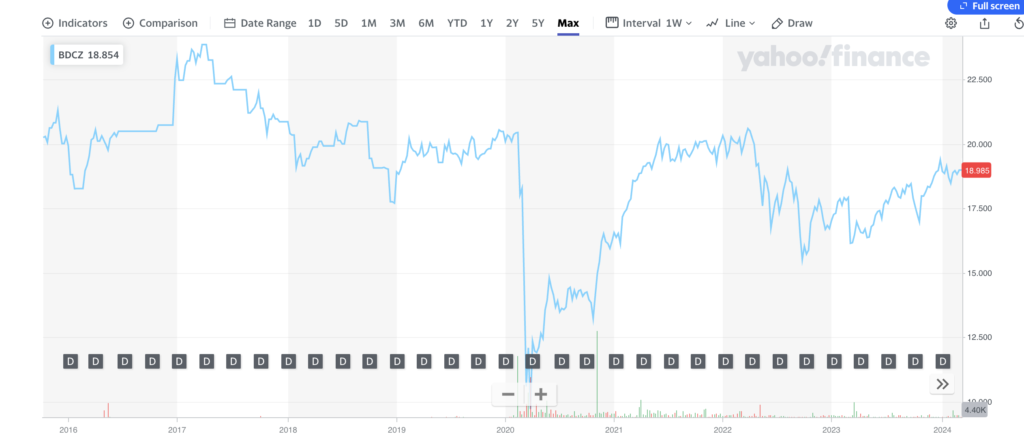
BDC stock prices – as measured by BDCZ – are only 2.3% away from reaching a new 52-week high and a 5.4% increase away from matching the price peak of 2022.
On the other hand – as we’ve noted before – BDCZ would have to increase by 22% to match its levels of 2017 when the ETN’s quarterly payout was very similar to the current levels.
See the price chart for BDCZ below:
Across The Spectrum
Whatever happens to the price of BDCZ – i.e. the sector as a whole – we feel confident in assuming that there will be a wide disparity in individual BDC price performance.
Already over the last 12 months we’ve seen the top BDC jump 45% in price and the worst performer drop (20%) for a 65% total spread.
The gap between the top performers and the worst is likely to grow even wider.
However, the still juicy dividends being paid out should keep “total return” losses modest even for under-achieving BDCs.
Already a Member? Log In
Register for the BDC Reporter
The BDC Reporter has been writing about the changing Business Development Company landscape for a decade. We’ve become the leading publication on the BDC industry, with several thousand readers every month. We offer a broad range of free articles like this one, brought to you by an industry veteran and professional investor with 30 years of leveraged finance experience. All you have to do is register, so we can learn a little more about you and your interests. Registration will take only a few seconds.