FS-KKR Capital: IVQ 2023 Credit Review
Premium FreeRead in conjunction with the BDC Credit Table.
PORTFOLIO
FS-KKR Capital’s (FSK) portfolio – valued at fair market value – was virtually unchanged in size at the end of the IVQ 2023 over the prior quarter, dropping ever so slightly from $14.666bn to $14.649bn. On a cost basis, though, FSK’s assets under management (AUM) grew slightly to reach $15.420bn. For the year as a whole, FSK’s portfolio at FMV dropped (5%) in size. Admittedly, since the IQ 2020 – when our record keeping begins – FSK has grown 111% but that’s entirely got to do with merging with its sister BDCs in early 2021.
However, the BDC Credit Table shows that the total number of companies in the portfolio has grown even if AUM is static. Back in IQ 2021 – when the merger occurred – there were 152 companies, versus 204 currently – a 31% increase and an apparent deliberate attempt to create greater diversification – an important element in risk management. Nonetheless – as a new calculation shown in the Credit Table illustrates in Column F – FSK has the highest average exposure per company in the BDC universe for which we have data. That leaves the BDC – as we shall see – exposed to potentially above-average credit losses when things go awry.
UNDERPERFORMING ASSETS
The BDC does offer shareholders a quarterly investment credit rating on a 4-point scale. Conservatively, we count ratings 2 through 4 to count up “underperforming assets”, with 3 and 4 reflecting the most seriously troubled assets.
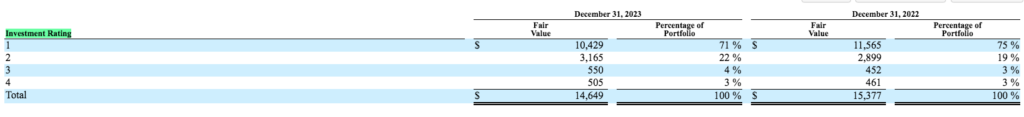
Counted in this way, “underperforming assets” amount to $4.220bn (see column AJ), or 28.8% of the total. The more troubled assets aggregate to $1.055bn, or 7% of the total. Depending on which number you choose FSK is either well over the percentage of assets we consider “normal” – i.e. 15% – or well below. That’s because an investment rating of 2, which FSK itself considers to be “performing” can also be considered to be troubled, going by the language in the 10-K:
“Investment Rating 2: Performing investment—no concern about repayment of both interest and our cost basis but company’s recent performance or trends in the industry require closer monitoring”.
FSK 10-K IVQ 2023
We’ve chosen to count investment rating 2 as underperforming. Readers can decide for themselves.
In any case, the FMV of each of the 3 lowest categories has increased over the last year and has gone from an aggregate of $3.820bn at the end of 2022 to $4.157bn in IIIQ 2023 to $4.220bn in the latest period. (We should point out that the data can mislead. Technically, this 10% increase in underperforming assets is not necessarily a negative development and could reflect higher valuations for some companies. We have to rely on the totality of the data – and some judgment – to determine if the BDC’s credit quality is improving, deteriorating, or at a standstill).
NON ACCRUAL
FSK is one of those BDCs that does not spell out how many of its portfolio companies have some or all their debt on non-accrual. That leaves us to read the notes in the 10-K and go through the Consolidated Schedule Of Investments (CSOI) to identify the non-performers. We apologize in advance if we missed any non-accrual while undertaking this hand count, which amounted to 14 companies – or 7% of the total company count.
According to FSK itself, non-accrual assets came to $880mn at year-end 2023. Unfortunately for the BDC’s shareholders, there is no doubt that this key metric has deteriorated in the last 3 months as this extract from the IVQ 2023 earnings press release shows:
As of December 31, 2023, investments on non-accrual status represented 5.5% and 8.9% of the total investment portfolio at fair value and amortized cost, respectively, compared to 2.4% and 4.8% as of September 30, 2023
FSK February 26, 2024 Press Relese
Naming Names
After many hours spent in FSK’s CSOI and reading the transcript of its conference call, we’ve gathered a great deal of information about these non-accruals in the NON-ACCRUAL tab of the BDC Credit Table. To our knowledge, this is the most complete data you’ll find anywhere on this critical subject. You’ll see we have both identified the companies on non-accrual; the FMV of all their assets and whether that number has increased, decreased, or remained the same since the last quarter (green indicates an increase, orange no material change, and red a decrease).
Need To Know
Note also that ARCC only gives the FMV of non-performing loans. We have chosen to count the FMV of all the assets of non-performing companies, to be as conservative as possible. In many cases, some tranches of debt are non-accrual while others are performing. Furthermore, we include equity and other non-income-producing assets of non-accrual companies.
Lost
A new metric we’ve just begun to add is the amount of annual investment income that seems to have been forgone. To calculate this we multiply the par value of any non-performing loan by its interest rate yield. To help us quickly distinguish the most important loss of income, the data is color-coded with bright red reserved for annual losses of income of $10mn or more, light red for $1mn-$10mn, and orange for under $1mn.
Getting Help
We have also noted in which quarter a non-accrual began. We use a color code of bright lime green for the most recent additions to the non-accrual list. We couldn’t do all this without the excellent resources of Solve-Advantage Data, which maintains an up-to-the-minute database of every BDC’s investment numbers – and much else besides – going back many years. What we do is switch back and forth between the Solve/Advantage Data records and the BD’s official filings to get as full a picture as possible. As with any mine, there’s a good deal of valuable material in there but a great deal of pick ax-wielding is involved.
Even More
In two other tabs, we have also begun to identify for each BDC and in every quarter which non-accruals have been removed and any realized loss (or gain) that might be involved. Once again we are swimming against the tide because FSK – and most other BDCs – often don’t identify the name of the companies that have incurred a realized loss or the amounts involved. That leaves us to become the Hercules Poirot of BDC credit and do our utmost to deduce with our “little grey cells” what has transpired.
Best We Can Do
In an ideal world, we’d like to reconcile every quarter all the changes in the names and values of non-performing companies. Realistically, though, we can only promise to do our best under the difficult circumstances involved, with so much not readily disclosed.
With that said, though, we think we’ve captured all the key changes that occurred in the IVQ 2023. The IIIQ 2023 ended with 2 FSK companies on non-accrual. By the end of 2023, the number had increased to 4. Two companies were removed from the non-accrual list: Matchesfahion and Sungard Availability Services. Both seem to have been written off in the period as the REALIZED GAINS & LOSSES tab shows.
Big.
For all of 2023, including forex changes, FSK booked ($323mn) in net realized losses. That’s a substantial amount and equal to 36% of NII. Over the last 5 years, total losses have amounted to ($547mn), so this year accounts for 59% of the total.
Newbies
This quarter, 4 new companies were added to the non-accrual list. The most notable was Kellermeyer Bergenson Services. The value of FSK’s total position is huge – even by its standard – at ($301mn) of FMV and ($358mn) at cost. However, only one of two loans – both due in 2027 – is on non-accrual right now, with a value of $197mn. By the way, Kellermeyer is a company that two other public BDCs have exposure to (ARCC and TCPC) on a more modest scale. Total BDC exposure is an unusually high $417mn. (We rate any exposure over $100mn as MAJOR). For FSK, we estimate that ($27mn) of interest is being forgone on just this one loan. That’s nearly ($0.10) per share. If the other loan becomes non-performing another ($9mn) of annual interest income will be involved.
For more “color”, we recommend subscribing to the BDC Credit Reporter where we delve into the backstories of ll important underperformers.
Impactful
Another body blow in the quarter was the non-accrual at Miami Beach Medical Group, with a total FMV of $107mn and an estimated ($16mn) of annual income forgone. There are 5 different tranches of debt involved. Ironically, the two most senior – and largest amounts involved – have been placed on non-accrual while the junior debt is still accruing income. Income forgone could increase by another ($4mn) if all debt defaults.
Also mentioned on the latest CC was Reliant Rehab Of Cincinnati, where one of two loans was placed on non-accrual. Then there is Sweeping Corp of America, which saw 3 loans, with an aggregate cost of $75mn, all added to the non-performing list in the IVQ 2023.
The Rest
We don’t have time here to go through the pluses and minuses of the IVQ 2023 for the 10 existing non-performing companies except to say that Arch Income and Wittur dropped materially in value and Global Jet and Bowery Farming improved. Some companies have been on the non-accrual list for years so it’s impossible to estimate when they will all be “realized”, although the BDC Credit Reporter does give the subject the old college try. Almost certainly the $1.1bn tied up at FMV in these 14 companies will result in hundreds of millions of further write-downs and realized losses.
MANAGEMENT RESPONSE
On the latest conference call analyst Finian O’Shea asked – in a roundabout way – the hard question of whether FSK’s credit performance has been good enough under the tenure of KKR, which took over from Blackstone several years ago. As this long extract from the conference call Q&A shows, management is not conceding, and continues to mostly point the finger at its predecessor:
Finian Patrick O’Shea Wells Fargo Securities, LLC, Research Division – Vice President and Senior Equity Analyst
Okay. And then just zooming out, follow on the advisor joint venture. There’s a lot of discussions still on — of your success in rotation, but the new FS/KKR Advisor is starting to chalk up its own sometimes significant credit losses. So do you think like — is it time maybe to look more inward, and on that matter, is the partnership model really working the right way for shareholders?
Daniel Ryan Pietrzak FS KKR Capital Corp. – Co-President, Chief Investment Officer & Director
… I think the partnership model has worked quite well. And I think, Fin, you got to look at the numbers a bit, right? When we did take over this portfolio, it was — the entities were sort of merged, it was roughly 75% sort of legacy assets, 25% so the KKR originated. That’s 87%, 13% today the other way, including 1 of the large positions as part of that 13% would have repaid in January.
You look at just total originations, I mean, look at $22 billion, $23-odd billion of originations inside of FSK since April of 2018 and a 50 basis point or sub-50 basis points sort of depreciation rate, which is realized and unrealized numbers, like that’s pretty good. And I looked at our kind of performance on the institutional funds that was investing in the same assets which has that sort of vintage, like those are sort of, I think, pretty strong numbers.
So we’re not happy with the quarter here, and I think we could be honest with that. And we were always expecting a certain amount of either nonaccruals or challenges in assets that we invested, it is a credit book, right? But I do think it’s a pretty interesting set, you look at roughly half of the nonaccruals are coming from 87% of the portfolio and roughly half of the nonaccruals are coming from 13% of the portfolio.
So we know we’re in the business of — in the credit business, you need to be right so the 99 out of 100 times, right? I think these credits, we’ve got a lot of focus on them from the deal team, the restructuring team, and we’re going to look to maximize value there. But I think that $22 billion to $23-odd billion is a pretty real number as is that sub-50 basis point depreciation rate.
FSK VQ 2023 Earnings Conference Call
CONCLUSION
Important
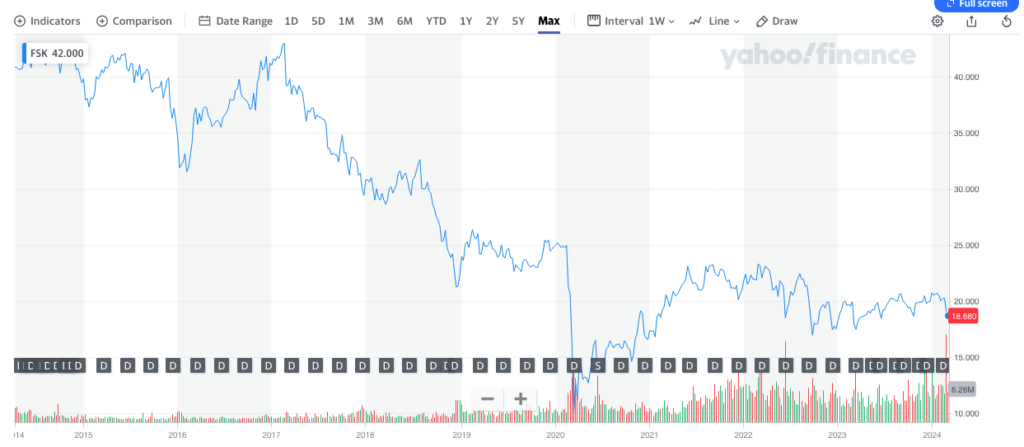
This is a much longer credit review than we normally write. This reflects the importance of the subject. FSK’s stock price has fallen (8%) since reporting its IVQ 2023 results, presumably mostly due to the increase in non-accruals and decrease in net asset value. However, this is not the first time that concerns have been elevated about the BDC’s credit status. As this chart shows, since mid-2017, FSK’s stock price has dropped by more than (50%). Net asset value per share (NAVPS) has fallen (34%) since IVQ 2017 and (22%) in the last 5 years- see the BDC NAV Change Table.
Mr. O’Shea – and investors generally – have a right to question whether FSK can achieve “NAV stability”. In this regard, FSK ranks in the bottom quartile amongst the 43 BDCs we track, notwithstanding the famous asset manager at the helm. This quarter’s performance has only added to the urgency of getting this answered correctly.
Simplified
We’ve waffled along at length above to show our readers what we’ve discovered by deep diving into the portfolio and into the credit results over time. However, we know that everyone does not have the time or energy to follow us down these credit rabbit holes. As a result, we’ve chosen in the BDC Credit Table to rate the credit performance of all the BDCs we track as either NORMAL or BELOW NORMAL. Unfortunately, FSK falls into the latter category, part of a small group of 6.
Enough?
The market is already well aware of FSK’s credit deficiencies. The BDC trades at a (23%) discount to its net book value per share and at a much lower price to 2024 earnings multiple than its peers such as Ares Capital (ARCC); Blackstone Secured Lending (BXSL) and Blue Owl Capital (OBDC). Does that discount sufficiently reflect the difference in credit performance? The answer to that is above our pay grade but we will be addressing the issue in BDC Best Ideas where we project out future BDC performance and potential values.
Already a Member? Log In
Register for the BDC Reporter
The BDC Reporter has been writing about the changing Business Development Company landscape for a decade. We’ve become the leading publication on the BDC industry, with several thousand readers every month. We offer a broad range of free articles like this one, brought to you by an industry veteran and professional investor with 30 years of leveraged finance experience. All you have to do is register, so we can learn a little more about you and your interests. Registration will take only a few seconds.