BDC Common Stocks Market Recap: Week Ended October 15, 2021
Premium FreeBDC COMMON STOCKS
Week 41
Are We There Yet ?
The BDC Reporter has been predicting for some time that BDC sector prices – already way up YTD and over 52 weeks – might reach a new top before 2021 comes to a close.
Of course, we’ve been hedging ourselves by warning that if the major indices slump materially, the BDC sector might follow.
Also, if BDC IIIQ 2021 results are less stellar than expected, investors might balk.
However, this week the markets renewed their ascent.
The Dow jumped 1.6% for the week, its biggest weekly percentage gain since June 25. The S&P 500 had its strongest weekly advance since July 23.
Yahoo Finance October 15, 2021
As for BDC earnings season, that’s still a fortnight away and all the signs remain auspicious that we’ll have another quarter of good earnings, higher NAV Per Share in most cases and dividend “surprises”.
Bigger Paydays
This week WhiteHorse Finance (WHF) announced a “special dividend”, which sets the BDC up to record a better 2021 than 2020 where total distributions are concerned, as we discussed in the Thursday BDC Daily Update.
We imagine there are several more such announcements of top-off distributions as the year draws to a close and BDCs ensure their taxable income is properly paid out, as per the sector’s rules.
All of which to say that the BDC sector had a good week price-wise, even breaking an important record, which we’ll get to shortly.
So Close
BDCZ – the UBS Exchange Traded Note which owns most sector stocks and which we use as one measuring tool of price performance – was nominally down from $20.07 to $19.84.
However, that was because this was the week of BDCZ’s quarterly distribution payment. Adjusting for that, the ETN was at $20.24, just a whisker away from its 52 week high point of $20.29.
BIZD – the only BDC ETF and another measuring stick – closed at $17.39, only (1.8%) off its own 52 week high.
Proving Our Point
38 of the 42 BDC common stocks we track were up in price – the best performance by that metric since June.
11 of the 38 were up by 3.0% or more. We’ve not seen that many BDCs in this category since early August.
Interestingly, for a third week in a row, there were no BDCs whose price dropped by (3.0%) or more in the week.
The momentum of the sector is clearly to the upside, as a look at BDC prices versus their 50 day and 200 day moving averages: 34 of the former are in the black and 36 of the latter.
18 BDCs are trading above their latest net book value per share.
24 BDCs are trading within 5% of their 52 week highs and 33 within 10%.
YTD only one BDC is in the red price-wise, and over a 1 year time frame none.
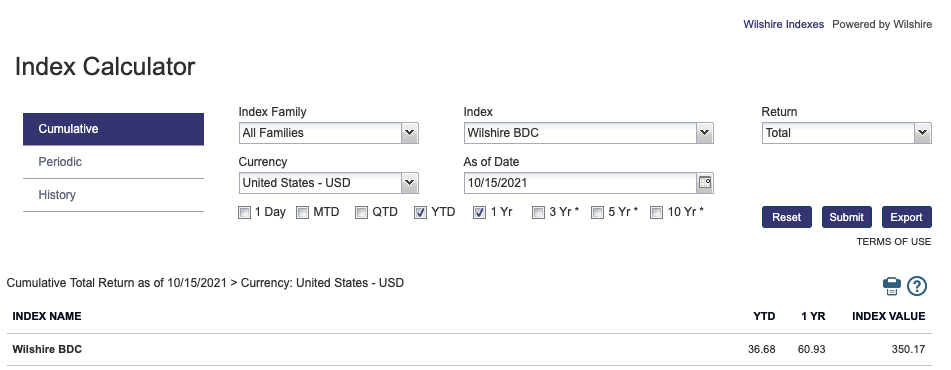
We’re throwing a lot of numbers at the issue, but the key one is the price of the BDC Wilshire Index that calculates total return.
GOAT
On Friday, that index reached its highest level EVER, resulting in the YTD and 1 year gains shown below:
Looking Forward
Of course, markets can turn on a dime, but the momentum of the last several weeks – after much hand wringing in September – suggests we’ll see higher levels – and new 52 week price records – for BDCZ and BIZD.
That could happen as early as next week.
Certainly, what news we’re getting in a piecemeal way suggests the BDC sector is doing well.
For example – and not covered in the BDC Daily Update due to lack of time – Golub Capital (GBDC) reported a huge quarter for new investment origination and much higher AUM:
Golub Capital BDC, Inc. (“GBDC”) (Nasdaq: GBDC, www.golubcapitalbdc.com), a business development company, today announced that it originated $971.4 million in new middle-market investment commitments during the three months ended September 30, 2021. …Total investments at fair value are estimated to have increased by approximately 10.2%, or $454.7 million, during the three months ended September 30, 2021 after factoring in debt repayments, sales of securities, net fundings on revolvers and net change in unrealized gains (losses).
Golub Capital Press Release October 14, 2021
Open For Business
Elsewhere, BDCs of all shapes and sizes continue to tap the unsecured debt markets for new, less expensive capital.
This week was PennantPark’s (PNNT) turn, along with perennial debt issuer Prospect Capital (PSEC). The week before – but completed this week – was FS KKR Capital (FSK) with two very large issuances.
The collateral damage is often the public BDC Baby Bond market. We’ve been updating the list of remaining public debt securities – 26 in all – and 5 are scheduled to be redeemed in the days and weeks ahead.
Also PhenixFIN (PFX) is getting its paperwork ready, which might mean Baby Bond PFXNL could be refinanced with new debt.
Interesting to see – should that happen – is whether secretive PFX – which is not part of any larger asset management group – raises funds from the public or private market.
There are several other BDCs standing in the wings with Baby Bonds or Convertibles which are coming up to their earliest redemption dates which we might be hearing from in the days ahead.
This is bad news for BDC debt investors but, in every case, the BDCs involved should be able to reduce their cost of borrowing – sometimes very materially – and for years to come.
Flip Side
Everything is coming up roses right now where BDCs are concerned, but this very busy, hyper competitive environment is fallow ground for seeding the credit problems of the future.
The BDC Reporter is old enough to have lived through enough lending cycles – sometimes as a lender, sometimes as a borrower – to recognize that danger might lie ahead.
As you can expect, the huge amount of capital available from PE groups and leveraged lenders has pushed transaction multiples for buyouts, acquisitions and recaps to incredible levels.
Here’s an extract of what Pitchbook had to say a few days ago:
“The US private equity industry is storming through 2021, smashing records as investors take advantage of a bullish climate and remain undeterred by the possibility of inflation and interest rate hikes. Our Q3 US PE Breakdown, sponsored by Liberty GTS, CohnReznick and Stout, tracks all the trends defining US private equity in what is shaping up to be a year to remember”.
Here are just some of the stats from a larger report:
- US PE dealmaking through Q3 has already broken 2019’s annual record for deal value, at over $787 billion.
- Exits are on an astounding run; year-to-date value has topped $638 billion—more than 50% above the previous high.
- Fundraising is proceeding at a rapid clip, and Q4 is expected to close the year on a strong note“.
Everyone’s Invited
We don’t want to be the voice of doom, but what invariably happens when capital is so abundant and valuations so high is that many would-be borrowers emerge.
Many are solid companies with long track records; tried and true management and sensible strategies.
However, there are also numerous entities that would previously have not been of interest to the PE buyers or the leveraged lenders because of their weak balance sheets; unreliable business outlook; inexperienced managers and so on and so on.
These companies are the future credit disasters we’ll be talking about either in late 2022 or 2023, and thereafter.
Of course, every BDC will tell you that they look through hundreds of potential transactions and only pick a tiny percentage to fund, and will avoid the future credit disasters.
We often hear BDC managers on conference calls tut-tutting about the risks their (always unnamed) peers are taking, while reassuring their shareholders that their own underwriting processes remain as solid as ever, unaffected by the hurly burly of the markets.
We say “from your lips to God’s ears”, but our experience is that this is rarely the case because competition for deals forces even the most serious minded lenders (and there are a lot of them) to have to cut corners in their due diligence; loosen protections in their documentation and accelerate the closing process to remain a meaningful player.
In this situation weak borrowers creep into portfolios even with all the credit goodwill in the world.
Left Guessing
It’s impossible for investors to really determine how good an individual BDC’s underwriting standards are while these deals are being added. We just have too little information, and even if we did, parsing out who will succeed and who will fail years down the road is a hopeless task.
Signs, Signs, Everywhere Signs
However, we will be worrying more about BDCs that launch into new market segments during this time; or are booking an inordinate amount of deals. Winning all your mandates is something of a poisoned chalice in this environment.
More anecdotally, we are keeping our ear to the ground when talking to borrowers, PE groups, other lenders and the BDCs themselves about what they’re witnessing about current deal doing. Years ago when Medley Capital, Fifth Street Finance and Triangle Capital were booking deals at a frenetic pace we did hear from “anonymous sources” that the rigorousness of their underwriting was questionable. Not very much later, those BDCs – now acquired by new managers – began to record an appallingly high number of new troubled credits.
As many of our readers know, we also publish the BDC Credit Reporter, where we write about underperforming and non performing companies that BDCs have financed. Frankly, of late there has been little raw material to write about and our attentions have been directed elsewhere.
However, we’re pretty certain that will not be the case for all that much longer.
At the moment – as we’ve shown above just about every BDC – judging by their prices – is faring well as all boats are lifted. As noted, we expect that to continue in 2021 and into 2022.
For Long Term Investors
However, how well BDCs today underwrite new credits will be the key determining factor of their success or otherwise if we look a little further out. Historic BDC credit performance has shown that there has been a huge variance in performance between the 42 players in this market.
Just take a look at the BDC NAV Change Table, and the column which calculates how NAV Per Share has performed since IVQ 2017 to IIQ 2021 for every BDC . The range of change in percentage terms is very wide: a positive 27% on one hand to a (68%) loss on the other. That’s over just three and a half years.
Differing credit performance is also at the root of the wide variance in BDC total returns for shareholders – calculated by Seeking Alpha – over longer periods. The SA table for 5 years shows shareholders achieving a gain as 239% over the last half decade (Capital Southwest), but also a loss as great as (62%), which relates to PFX.
At the moment, with all BDCs registering higher prices in 2021, investors might feel that whatever stock you pick is going to result in a positive. That has been true – and may continue for awhile. In the longer run, though, that has never been the case and will not be in the future.
As in any good capitalist system – and leveraged lending is very much one – there will be winners and loserrs, and the differential between them is likely to be substantial.
Register for the BDC Reporter
The BDC Reporter has been writing about the changing Business Development Company landscape for a decade. We’ve become the leading publication on the BDC industry, with several thousand readers every month. We offer a broad range of free articles like this one, brought to you by an industry veteran and professional investor with 30 years of leveraged finance experience. All you have to do is register, so we can learn a little more about you and your interests. Registration will take only a few seconds.