BDC Common Stocks Market Recap: Week Ended January 2, 2026
One Ends. Another Begins.
BDC COMMON STOCKS
Week 53 – 2025
Week 1 – 2026
For the week, the S&P 500 (SP500) was -1.1% lower, while the tech-heavy Nasdaq (COMP:IND) lost -1.6%, and the blue-chip Dow ended -0.7%.
Seeking Alpha- Wall street breakfast january 3, 2026
Catching Up With 2025’s Results
We’re back after a week away to celebrate the holidays.
The last closing price for BIZD – the Van Eck BDC sector exchange traded fund – closed at $14.43 on Friday December 19, 2025.
Roll forward to New Year’s Eve, and BIZD closed the year at $14.18.
That’s ($0.25) lower, or (1.7%) but in the intervening fortnight BIZD coughed up its final dividend of the year of $0.4020 a share, so on a total return basis BIZD was slightly up over this period.
Now we can tell you that BIZD was down (14.7%) in price from the end of 2024 to the end of 2025 and ended the year (20.7%) behind the ETF’s February 2025 high point.
Need we say this was a very weak result? The S&P 500 was up 16.6% in price terms, which is even more depressing.
Comparison
If it’s any consolation, this was not the worst year ever for BIZD's annual price decline. There have been 3 prior occasions that the BDC dropped more: up to (18.03%).
| Year | Year-End Price | Price Change | Price Return (%) |
| 2013 | $20.98 | – | – |
| 2014 | $17.93 | -$3.05 | -14.54% |
| 2015 | $15.77 | -$2.16 | -12.05% |
| 2016 | $18.01 | +$2.24 | +14.20% |
| 2017 | $16.60 | -$1.41 | -7.83% |
| 2018 | $14.04 | -$2.56 | -15.42% |
| 2019 | $16.75 | +$2.71 | +19.30% |
| 2020 | $13.73 | -$3.02 | -18.03% |
| 2021 | $17.21 | +$3.48 | +25.35% |
| 2022 | $14.15 | -$3.06 | -17.78% |
| 2023 | $16.04 | +$1.89 | +13.36% |
| 2024 | $16.63* | +$0.59 | +3.68% |
| 2025 | $14.18 | -$2.45 | -14.73% |
Thank Goodness For Dividends
The annual results are a little less dismal thanks to the requirement that BDCs distribute close to all their earnings to shareholders.
2025 was another robust year for payouts. They aggregated $1.672 per share.
At BIZD’s average price for 2025 of $1.5405, the yield is 10.9%.
With those dividends figured in, the BIZD total return – according to Perplexity, quoting RealReturns – was (4.95%).
The S&P BDC Index total return calculation – always a little different – was a loss of (3.5%).
Both total returns are far, far below the S&P 500’s 16.9% all-in gain, but you knew that.
Getting Specific
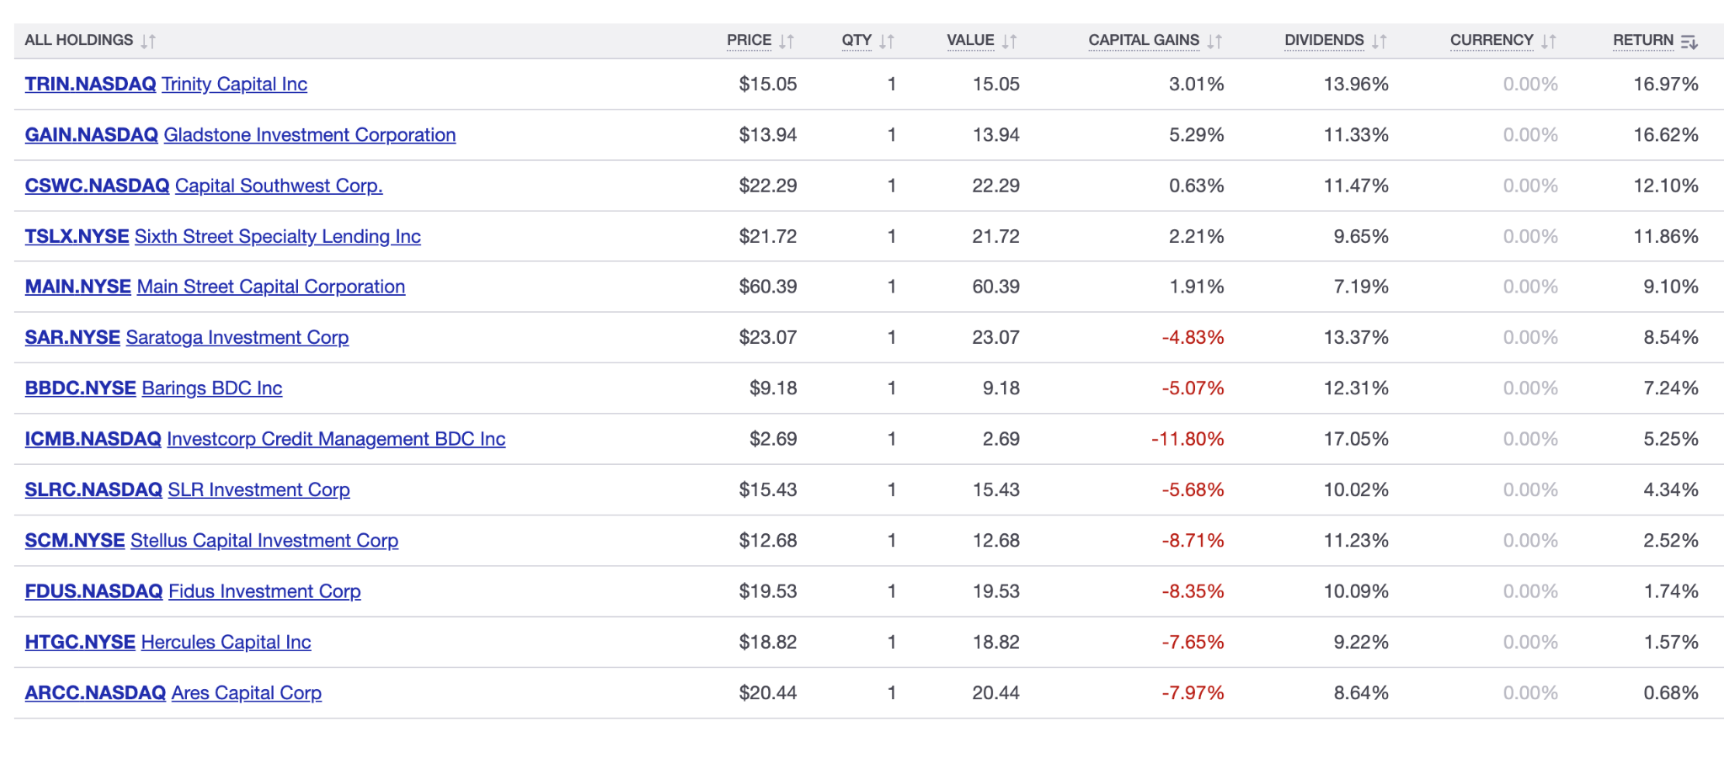
Only 5 BDCs managed to eke out a price gain over all of 2025 – three lower middle market BDCs (GAIN, MAIN and CSWC); one venture-debt lender (TRIN) and one aimed at the middle market (TSLX).
On the other side of the price change table, there were some huge price drops recorded in 2025.
OFS Capital (OFS) – which we’ve written about multiple times in recent times – is down the most with a (42%) drop.
Second on the list – and one of the biggest BDCs by assets under management – is Prospect Capital (PSEC), down (41%).
Also, one of the bigger BDCs is Blackrock TCP Capital (TCPC), down (38%). It’s another reminder – if one is needed – that a famous asset manager as a parent is no guarantee of success.
We could go on, but we’ll end here by noting that 16 BDCs – roughly a third of our coverage universe – dropped (20%) or more in price – ursine territory – in 2025.
Best We Can Offer
The only “good news” is that those robust dividends did drive 13 BDCs' total return into the black.
Most impressive were TRIN, GAIN, CSWC and TSLX – all of whom generated double digit percentage returns.
TRIN even managed to (ever so slightly) top the total return of the S&P 500: 17.0% all-in.
Bringing You Up To Date.
2025 is now in the record books.
Let’s see how 2026 is going after 1 trading day…
BIZD increased 0.6% to $14.27.
WHERE WE STAND
With one foot already into 2026, here’s where BDC prices stand:
None are trading within 5% of their 52 week highs and only 2 are between 5%-10%.
On the other hand, 8 are within 5% of their 52 week lows and 17 are 5%-10% above.
PSEC – which attracted the ire of Bloomberg last year – also reached a new nadir this week.
The former offers a dividend yield of nearly 14% and the latter a yield of over 20%.
Clearly, the markets do not expect either BDC to maintain its current payouts for long in 2026.
PSEC is paying $0.54 per year, but analysts project recurring earnings per share will reach only $0.42 in the 2026 fiscal year.
The situation is a little different for GSBD, whose payout annualizes at $1.28 while the analysts are predicting $1.31 in recurring earnings per share.
The Few
Only 7 BDCs are trading at or above their net asset value per share (NAVPS).
When the market is feeling its oats, that number can be 20 or 21.
Wider Perspective
One Ends. Another Begins.
BDC COMMON STOCKS
Week 53 – 2025
Week 1 – 2026
For the week, the S&P 500 (SP500) was -1.1% lower, while the tech-heavy Nasdaq (COMP:IND) lost -1.6%, and the blue-chip Dow ended -0.7%.
Seeking Alpha- Wall street breakfast january 3, 2026
Catching Up With 2025’s Results
We’re back after a week away to celebrate the holidays.
The last closing price for BIZD – the Van Eck BDC sector exchange traded fund – closed at $14.43 on Friday December 19, 2025.
Roll forward to New Year’s Eve, and BIZD closed the year at $14.18.
That’s ($0.25) lower, or (1.7%) but in the intervening fortnight BIZD coughed up its final dividend of the year of $0.4020 a share, so on a total return basis BIZD was slightly up over this period.
Now we can tell you that BIZD was down (14.7%) in price from the end of 2024 to the end of 2025 and ended the year (20.7%) behind the ETF’s February 2025 high point.
Need we say this was a very weak result? The S&P 500 was up 16.6% in price terms, which is even more depressing.
Comparison
If it’s any consolation, this was not the worst year ever for BIZD's annual price decline. There have been 3 prior occasions that the BDC dropped more: up to (18.03%).
| Year | Year-End Price | Price Change | Price Return (%) |
| 2013 | $20.98 | – | – |
| 2014 | $17.93 | -$3.05 | -14.54% |
| 2015 | $15.77 | -$2.16 | -12.05% |
| 2016 | $18.01 | +$2.24 | +14.20% |
| 2017 | $16.60 | -$1.41 | -7.83% |
| 2018 | $14.04 | -$2.56 | -15.42% |
| 2019 | $16.75 | +$2.71 | +19.30% |
| 2020 | $13.73 | -$3.02 | -18.03% |
| 2021 | $17.21 | +$3.48 | +25.35% |
| 2022 | $14.15 | -$3.06 | -17.78% |
| 2023 | $16.04 | +$1.89 | +13.36% |
| 2024 | $16.63* | +$0.59 | +3.68% |
| 2025 | $14.18 | -$2.45 | -14.73% |
Thank Goodness For Dividends
The annual results are a little less dismal thanks to the requirement that BDCs distribute nearly all of their earnings to shareholders.
2025 was another robust year for payouts. They aggregated $1.672 per share.

On BIZD’s average price for 2025 of $1.5405, that represents a yield of 10.9%.
With those dividends figured in, the BIZD total return – according to Perplexity, quoting RealReturns – was (4.95%).
The S&P BDC Index total return calculation – always a little different – was a loss of (3.5%).
Both total returns are far, far below the S&P 500’s 16.9% all-in gain, but you knew that.
Getting Specific
Only 5 BDCs managed to eke out a price gain over all of 2025 – three lower middle market BDCs (GAIN,MAIN and CSWC); one venture-debt lender (TRIN) and one aimed at the middle market (TSLX).
On the other side of the price change table there were some huge price drops recorded in 2025.
OFS Capital (OFS) – which we’ve written about multiple times in recent times – is down the most with a (42%) drop.
Second on the list – and one of the biggest BDCs by assets under management – is Prospect Capital (PSEC), down (41%).
Also, one of the bigger BDCs is Blackrock TCP Capital (TCPC), down (38%). It’s another reminder – if one is needed – that a famous asset manager as a parent is no guarantee of success.
We could go on, but we’ll end here by noting that 16 BDCs – roughly a third of our coverage universe – dropped (20%) or more in price – ursine territory – in 2025.
Best We Can Offer
The only “good news” is that those robust dividends did drive 13 BDCs' total return into the black.
Most impressive were TRIN, GAIN, CSWC and TSLX – all of whom generated double digit percentage returns.
TRIN even managed to (ever so slightly) top the total return of the S&P 500: 17.0% all-in.
Bringing You Up To Date.
2025 is now in the record books.
Let’s see how 2026 is going after 1 trading day…
BIZD increased 0.6% to $14.27.
WHERE WE STAND
With one foot already into 2026, here’s where BDC prices stand:
None are trading within 5% of their 52 week highs and only 2 are between 5%-10%.
On the other hand, 8 are within 5% of their 52 week lows and 17 are 5%-10% above.
This week saw Goldman Sachs BDC (GSBD) – the subject of a negative article in the Wall Street Journal on Christmas Day – reach a new 52-week low.
PSEC – which attracted the ire of Bloomberg last year – also reached a new nadir this week.
The former offers a dividend yield of nearly 14% and the latter a yield over 20%.
Clearly, the markets do not expect either BDC to maintain its current payouts for long in 2026.
PSEC is paying $0.54 per year, but analysts project recurring earnings per share will reach only $0.42 in the 2026 fiscal year.
The situation is a little different for GSBD, whose payout annualizes to $1.28, while analysts are forecasting $1.31 in recurring earnings per share.
The Few
Only 7 BDCs are trading at or above their net asset value per share (NAVPS).
When the market is feeling its oats, that number can be 20 or 21.
Wider Perspective
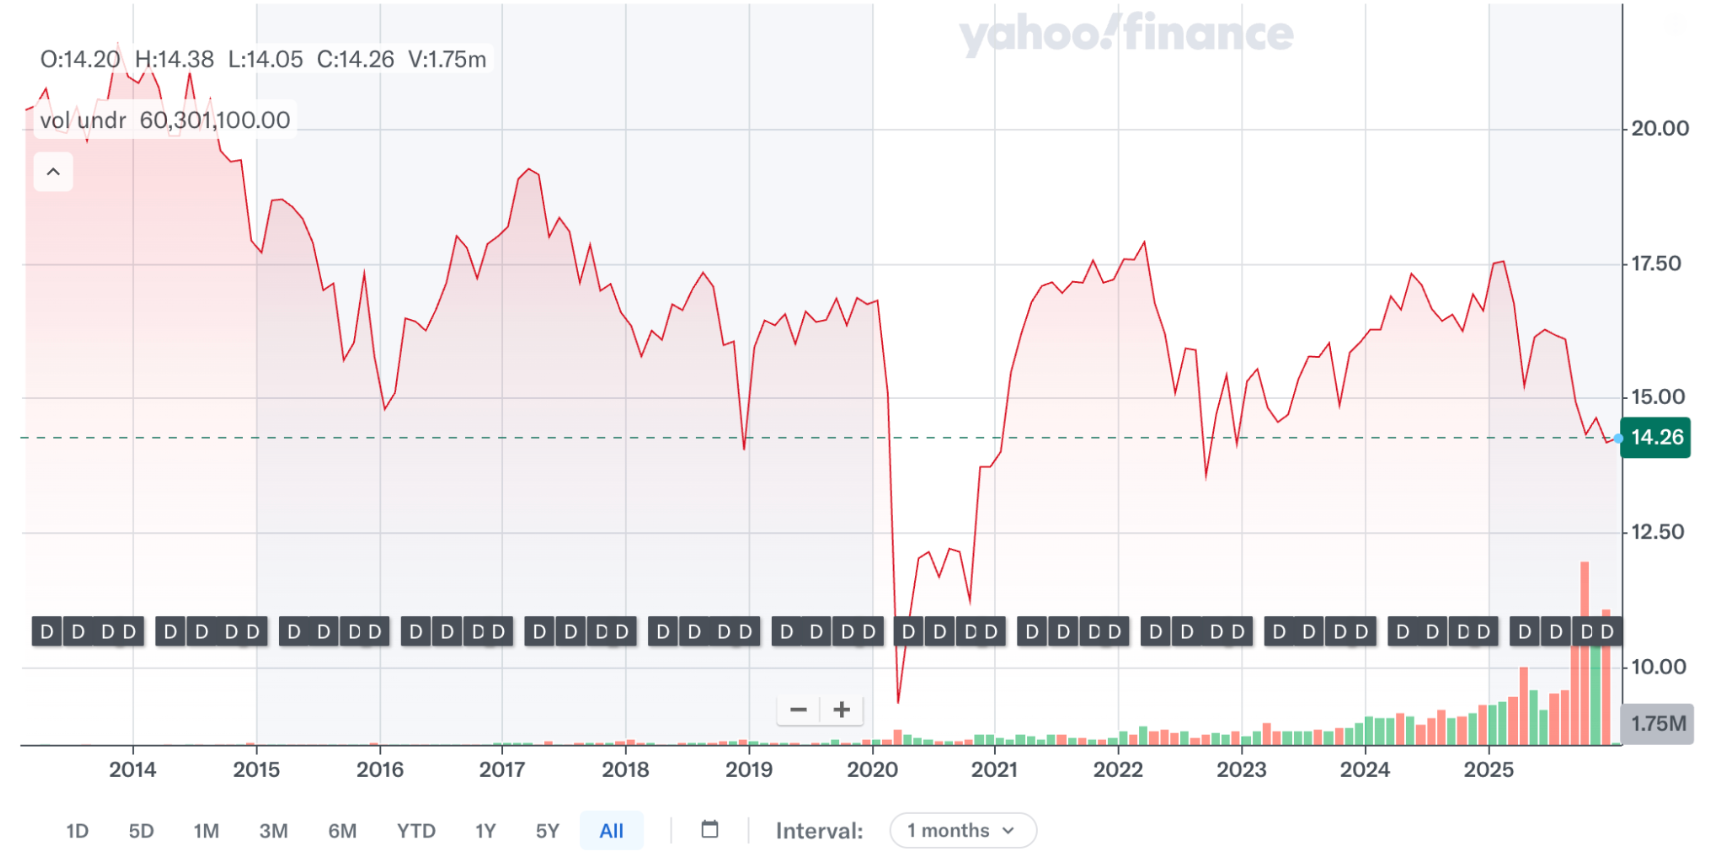
If we look at the long term stock price chart for BIZD, we can see that outside of a portion of the Covid period and a couple of months in 2022 when everyone was certain a recession was on the agenda, the sector is in the dumps.
Even the 11.3% yield on BIZD – annualizing the latest dividend and dividing by Friday’s closing price – is not enough to excite investors who seem to be anticipating worse times ahead.
WHERE ARE WE HEADED
Timescales
Let’s discuss both the short run (next few months) and the medium term (all of 2026).
Undoubtedly in the IVQ 2025 and IQ 2026 BDC results you are going to see BDC earnings take a dip.
Three Fed rate cuts that brought SOFR down from 4.51% in September 2025 to 3.87% at year-end will roll through BDC P&Ls into the first few months of this year.
The latest (0.25%) cut was in mid-December and won’t show up till the IQ 2026.
The earlier cuts in September and November won’t be fully reflected till this current calendar quarter.
While the fourth quarter tends to be a busy time for lenders, which may offset some earnings lost to lower rates, the first quarter of every year tends to be on the light side.
So we’re expecting to see BDC earnings reach their softest point in the IQ 2026, which will be revealed from April on.
Back And Forth
What happens after that is the subject of avid debate in the markets.
At no time in recent years have we seen observers – and the key decision makers that they’re looking over the shoulder of – so divided.
From a BDC standpoint, the worst outcome might be a compliant Fed turning its back on the Battle Against Inflation and continuing to cut rates several more times in 2026.
That could bring SOFR down to 3.0% – or even lower if Stephen Miran and President Trump get their way.
The market, though, seems to be budgeting for one or two more cuts, bringing SOFR towards 3.25%, or 3.5% at best.
Our Controversial View
Then there’s the question of whether the alleged credit “cracks” in leveraged lending actually result in a material increase in losses.
We’ve had a break from this relentless hand wringing over the holiday period – barring that WSJ article about GSBD – but all we’ll need is a well known company to get into trouble for the doom-saying to return.
This week, the parent of Saks Fifth Avenue is said to be preparing to seek the court’s protection shortly.
We noted this on X but also mentioned that in the billions of dollars owed, all are due to banks, junk bond holders, and CLOs that hold syndicated loans; not one public BDC is involved.
Nothing Showing
Over at our sister publication – the BDC Credit Reporter – we continue not to see any pick-up in BDC credit travails.
There were 50 new non-accruals in the IIIQ 2025, which probably amounts to about three dozen companies given multiple holdings, which is about normal in a universe of thousands of borrowers.
We’re still working our way through all the troubled names but there is nothing out of the ordinary to report as far as we can see.
Back in 2008, when the credit landscape turned sour, not a day passed without some news of a BDC-financed company suddenly in deep trouble.
Rated
For what it’s worth the BDC Credit Reporter rates every BDC on a 1 to 5 scale where long term credit performance is concerned.
There are 8 BDCs tarred with our lowest rating of 5 – severely underperforming.
However, all but one – OFS – were already in deep credit trouble a year or more ago.
We’ll need to see substantial deterioration in performance amongst the BDCs rated higher on our scale before worrying too much.
Watch That Space
All this to say that we expect changes in rates to be much more of a factor than anything else, where overall BDC earnings performance is concerned.
Just how low rates go will be a critical factor in where BDC prices go.
Alternatives
We could still get a price slump if rates head lower than most anticipate and we could a price jump if rates stabilize at this level or increase.
If interest rates perform pretty much as expected, the market may be satisfied that prices have already adjusted appropriately.
Of course – like with the Spiderman franchise – there are endless ways this could go, but the likeliest scenario in our minds is that BDC prices stay more or less flat this year – albeit with plenty of volatility along the way – but the total return – thanks to dividends paid – logs in in the 10%-12% range.
That’s no Nvidia but would represent both a much better performance than in 2025 and slightly better than the long term returns of both BIZD and the S&P BDC Index.
It could happen.
We’ll be here every week, keeping score.
If we look at the long term stock price chart for BIZD, we can see that outside of a portion of the Covid period and a couple of months in 2022 when everyone was certain a recession was on the agenda, the sector is in the dumps.
Even the 11.3% yield on BIZD – annualizing the latest dividend and dividing by Friday’s closing price – is not enough to excite investors who seem to be anticipating worse times ahead.
WHERE ARE WE HEADED
Timescales
Let’s discuss both the short run (next few months) and the medium term (all of 2026).
Undoubtedly in the IVQ 2025 and IQ 2026 BDC results you are going to see BDC earnings take a dip.
Three Fed rate cuts that brought SOFR down from 4.51% in September 2025 to 3.87% at year-end will roll through BDC P&Ls into the first few months of this year.
The latest (0.25%) cut was in mid-December and won’t show up till the IQ 2026.
The earlier cuts in September and November won’t be fully reflected till this current calendar quarter.
While the fourth quarter tends to be a busy time for lenders, which may offset some earnings lost to lower rates, the first quarter of every year tends to be on the light side.
So we’re expecting to see BDC earnings reach their softest point in the IQ 2026, which will be revealed from April on.
Back And Forth
What happens after that is the subject of avid debate in the markets.
At no time in recent years have we seen observers – and the key decision makers that they’re looking over the shoulder of – so divided.
From a BDC standpoint, the worst outcome might be a compliant Fed turning its back on the Battle Against Inflation and continuing to cut rates several more times in 2026.
That could bring SOFR down to 3.0% – or even lower if Stephen Miran and President Trump get their way.
The market, though, seems to be budgeting for one or two more cuts, bringing SOFR towards 3.25%, or 3.5% at best.
Our Controversial View
Then there’s the question of whether the alleged credit “cracks” in leveraged lending actually result in a material increase in losses.
We’ve had a break from this relentless hand wringing over the holiday period – barring that WSJ article about GSBD – but all we’ll need is a well known company to get into trouble for the doom-saying to return.
This week, the parent of Saks Fifth Avenue is said to be preparing to seek the court’s protection shortly.
We noted this on X but also mentioned that in the billions of dollars owed, all are due to banks, junk bond holders, and CLOs that hold syndicated loans; not one public BDC is involved.
Nothing Showing
Over at our sister publication – the BDC Credit Reporter – we continue not to see any pick-up in BDC credit travails.
There were 50 new non-accruals in the IIIQ 2025, likely representing about three dozen companies given multiple holdings, which is about normal in a universe of thousands of borrowers.
We’re still working our way through all the troubled names, but there is nothing out of the ordinary to report as far as we can see.
Back in 2008, when the credit landscape turned sour, not a day passed without some news of a BDC-financed company suddenly in deep trouble.
Rated
For what it’s worth the BDC Credit Reporter rates every BDC on a 1 to 5 scale where long term credit performance is concerned.
There are 8 BDCs tarred with our lowest rating of 5 – severely underperforming.
However, all but one – OFS – were already in deep credit trouble a year or more ago.
We’ll need to see substantial deterioration in performance amongst the BDCs rated higher on our scale before worrying too much.
Watch That Space
All this to say that we expect changes in rates to be much more of a factor than anything else, where overall BDC earnings performance is concerned.
Just how low rates go will be a critical factor in where BDC prices go.
Alternatives
We could still get a price slump if rates head lower than most anticipate and we could a price jump if rates stabilize at this level or increase.
If interest rates perform pretty much as expected, the market may be satisfied that prices have already adjusted appropriately.
Of course – like with the Spiderman franchise – there are endless ways this could go, but the likeliest scenario in our minds is that BDC prices stay more or less flat this year – albeit with plenty of volatility along the way – but the total return – thanks to dividends paid – logs in in the 10%-12% range.
That’s no Nvidia but would represent both a much better performance than in 2025 and slightly better than the long term returns of both BIZD and the S&P BDC Index.
It could happen.
We’ll be here every week, keeping score.