
BDC NAV Changes in the IVQ 2025: Findings and Conclusions
INTRODUCTION
Rightly or wrongly, we’ve waited a very long time – literally till the last day of the first quarter of 2026 to review the BDC’s sector’s net asset value per share performance (NAVPS) in the final quarter of 2025. Please see the BDC NAV Change Table in your Subscriber Tools for the full document. We were waiting on Investcorp Credit Management BDC (ICMB), which has only just released its quarterly and full-year results. (There’s a major crisis underway at ICMB, which we’ll be writing about in the next 48 hours, but that’s another issue.)
In this article, we’re going to review the key NAVPS metrics for the most recent quarter. Regular readers will know that the BDC Reporter believes trends in a BDC’s NAVPS are some of the best indicators of relative financial health and, even, future outlook. Moreover, when we look at the sector as a whole – 46 BDCs with $175bn in portfolio investments, spread over 5,000 plus portfolio companies, NAVPS trends speak to the public BDC sector as a whole.
For anybody with an interest in non-traded BDCs – much in the news right now – remember the public and private BDCs have very similar portfolios and are constructed by the same external management teams. While we don’t track every non-traded BDC’s NAVPS, much can be inferred from the results in the BDC NAV Change Table. Let’s get to work:
ANALYSIS
SELECT DATA FROM THE NAV CHANGE TABLE
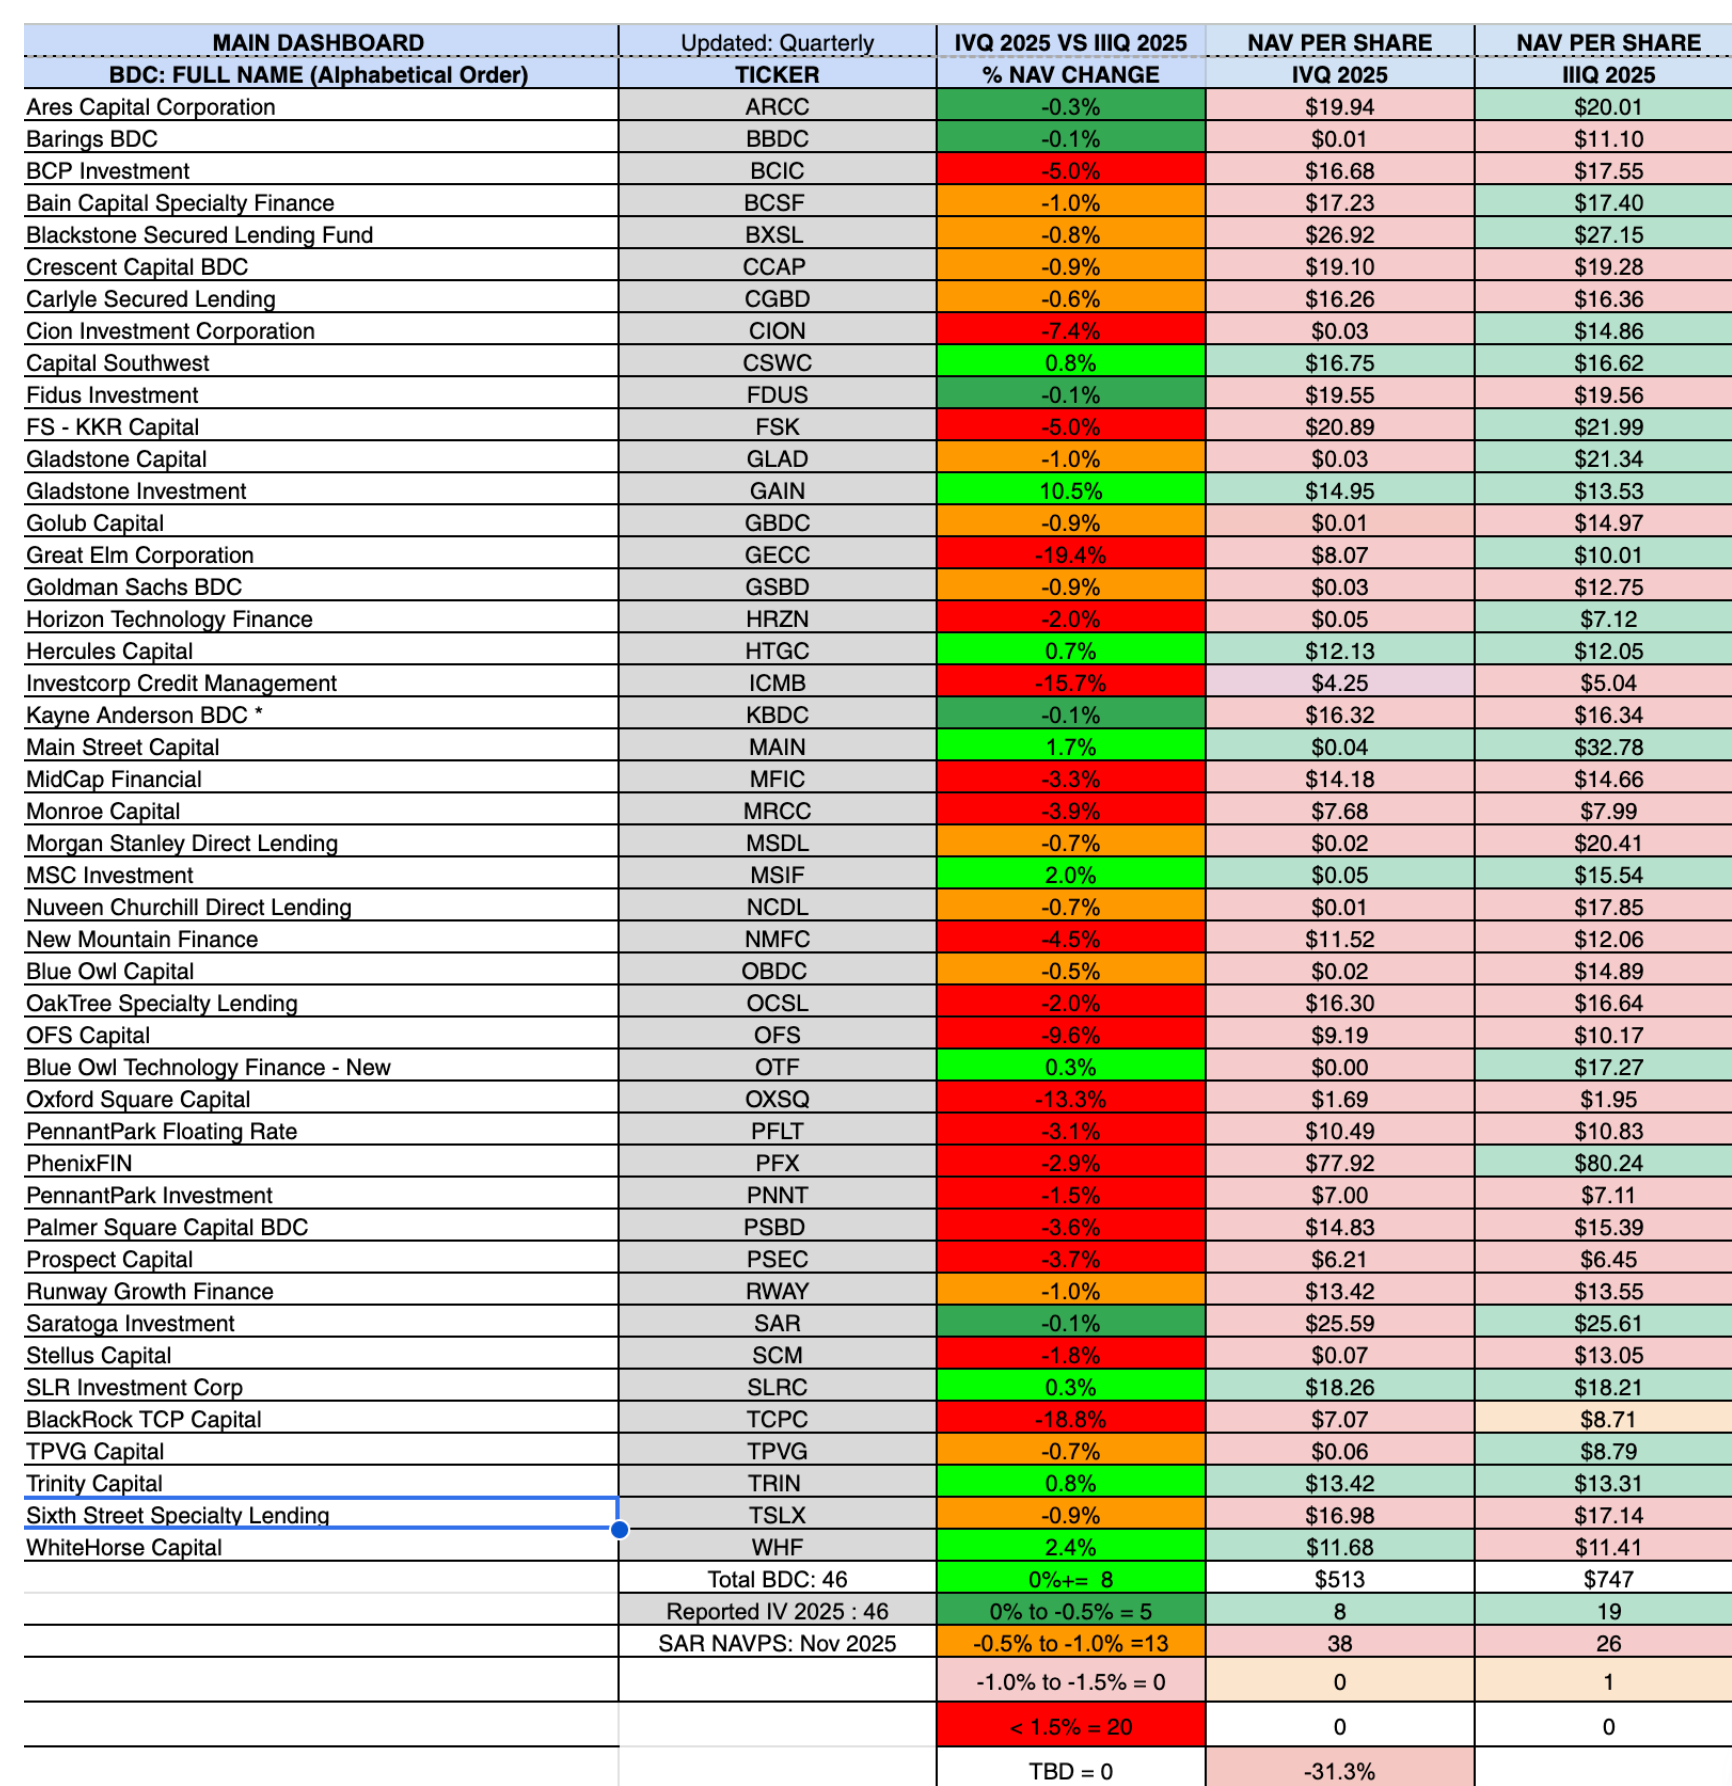
For every BDC, we are showing the NAVPS in the IIIQ 2025 and IVQ 2025 and the percentage change. At the bottom of the columns for the NAVPS in the IVQ 2025, we show how many BDCs increased in price and how many dropped in the quarter. In the quarterly percent change column at the bottom, we count the number of BDCs in each category of percentage NAVPS change. More on that below.
IVQ 2025 Winners
Before we turn to the many BDCs that performed badly in the last 3 months of 2025 by this metric, let’s not forget that there were several exemplary performances in the period. We highlight in bright green any BDC that managed to increase its NAVPS in the quarter. We consider this out-performance. A loss of up to (0.5%) over the prior quarter’s NAVPS is highlighted in forest green. This is a performance we rate as being within what one should expect from a BDC.
Anyway, there were 8 BDCs in the top category and 5 in the second, for a total of 13, or 28% of the total. Far and away the best performer in this category was Gladstone Investment (GAIN), whose NAVPS increased over 10% in 3 months. This was due to the unrealized appreciation of several equity positions. GAIN is generally recognized as much as a PE group as a lender, and when the stars align, the result can be big upward swings in book value. The downside from a shareholder’s standpoint is that the BDC has less capital than most to deploy into debt, which results in a modest – if steady – dividend. Investors are hoping these unrealized gains will get crystallized into equity income, which can be distributed. No wonder GAIN is one of only a handful of BDCs whose stock price has held up this year.
As we’ll discuss later, virtually all the “Winners” in the IVQ 2025 enjoy long-term track records of maintaining or increasing NAVPS. There is one notable exception this quarter: WhiteHorse Finance (WHF), whose NAVPS increased by 2.3%. This BDC had been struggling with numerous credit issues for years. In fact, until the IVQ 2025, WHF’s NAVPS had dropped for 16 quarters in a row! In this most recent quarter, the BDC managed to eke out a small net realized and unrealized gain, buy back a considerable number of its shares at a discount, and generate income in excess of the payout – all of which contributed to the positive result. Will that trend continue in 2026? Of course, it’s hard to say, but – by our estimate – the BDC has only 3 “Important Underperformers” on the books. These are companies valued at less than 80% of cost and with an FMV greater than $5mn. That augurs well for the future. The market is optimistic. WHF is the only BDC whose stock price is in the black in 2026 – up 2.7%.
IVQ 2025 Underperformers
Underperforming BDCs – according to our rating system – far exceeded the “Winners”. There were 33 of them, but spread over a wide spectrum. Let’s go to the extreme and look at the BDCs whose NAVPS dropped by (1.5%) or more. These BDCs are rated 5 on our 5-point scale. A (1.5%) NAVPS decline may not seem significant, but multiply that sort of loss over 5 years, and a BDC would lose nearly a third of its value. In any case, a large number of BDCS far exceeded the (1.5%) NAVPS change starting point.
The worst performer in this quarter was Great Elm Capital (GECC), down (19.4%). This tiny BDC had been in revival mode before getting caught up in the First Brands fraud. However, the losses there were compounded by a ($12.4mn) realized loss on Dynata and other troubled positions. GECC is the 7th worst price performer in 2026, down (37%).
However, the BDC has plenty of company. There were 3 other BDCs with a NAVPS percentage drop in double digits: BlackRock TCP (TCPC) at (18.8%); ICMB at (15.7%), and Oxford Square Capital (OXSQ) at (13.3%).
The TCPC drop has garnered most of the headlines, given its famous manager and its much larger AUM than the others. For example, TCPC is 5x larger than GECC and 9x larger than ICMB. The depth of TCPC’s decline was a little surprising, but the BDC has not registered an increase in its NAVPS since the IIQ of 2023. TCPC is the second-worst price performer in the public BDC universe in 2026, down (37%). Only BCIC has performed worse price-wise. Its NAVPS fell (5.0%).
There is a glass half full way to approach the BDC NAV Change Table in that 13 BDCs experienced a relatively modest loss of (0.5%) – (1.0%) of NAVPS. In our rating system, that’s tagged a 3 rating, but it is the highest rung of the underperforming group. Many relatively popular BDCs fall into this cohort, including Blackstone Secured Lending, off (0.8%); Gladstone Capital (GLAD), off (1.0%), and Sixth Street Specialty Lending (TSLX), off (0.9%).
It’s dangerous to paint these issues with too broad a brush, but – in general – the worst performers are contending with higher levels of unrealized portfolio losses, which are depleting their NAVPS. A secondary factor is that some BDCs insisted on paying dividends in excess of their income, which also erodes book value. Although many BDCs bought back shares at levels not seen in many years, the ensuing boost to NAVPS did little to help.
CONCLUSION
The IVQ 2025 was the worst quarter of the year in terms of the percentage decline in NAVPS quarter over quarter: down (1.8%) on an unweighted basis. However, given that 8 BDCs increased their NAVPS this quarter, the IVQ was not as bad as the IQ 2025, when 6 were in the black.
However, the most notable takeaway from our perspective is the very large number of BDCs in the IVQ 2025 whose NAVS dropped by (1.5%) or more. There were 20 of them, much more than in any other quarter of the year. In the IQ 2025, there were 13, the prior record.
This does suggest worsening credit performance, showing up in unrealized losses and ultimately in the NAVPS. However, the picture is mixed, as a sizable number of BDCs are able to swim against those currents and either increase their book value or incur very modest losses.
No single quarter should be taken too seriously, whether positive or negative. More valuable is looking at trends over longer periods. Unfortunately, we don’t have room in this article to discuss the 1 Year and 5 Year NAVPS change data we’ve assembled. If time permits, we’ll write another article that pulls back the lens, which may lead to different conclusions.